Level 1
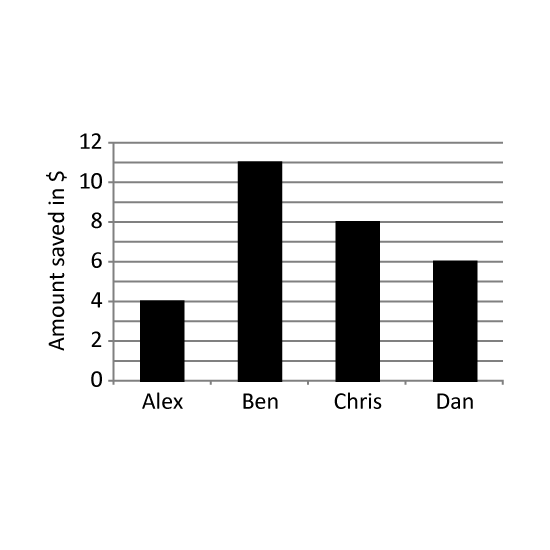
Four friends were given a sum of $25 each. The bar graph shows the amount of money saved by each of them in the week. How much did they spend together?
Level 1
Four friends were given a sum of $25 each. The bar graph shows the amount of money saved by each of them in the week. How much did they spend together?
Level 2
Hillary bought 12 buns and 15 doughnuts altogether. One bun is y ¢ and one doughnut is $2. She gave the cashier $50. Express her change in terms of y in cents.
Level 2
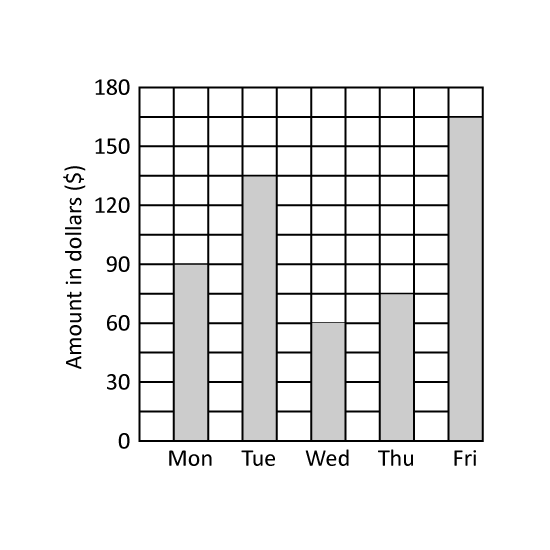
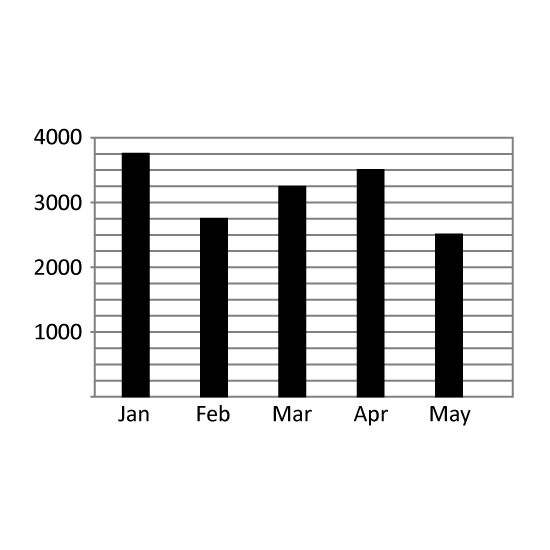
The graph shows how much Mary earned from Monday to Friday. The total amount Mary earned on two of the days is the same as what she earned on Tuesday. Which were the two days? Give the answers in short form. (Eg Mon, Thu)
Level 2
The graph shows how much Mary earned from Monday to Friday. The total amount Mary earned on two of the days is the same as what she earned on Tuesday. Which were the two days? Give the answers in short form. (Eg Mon, Thu)