Level 1
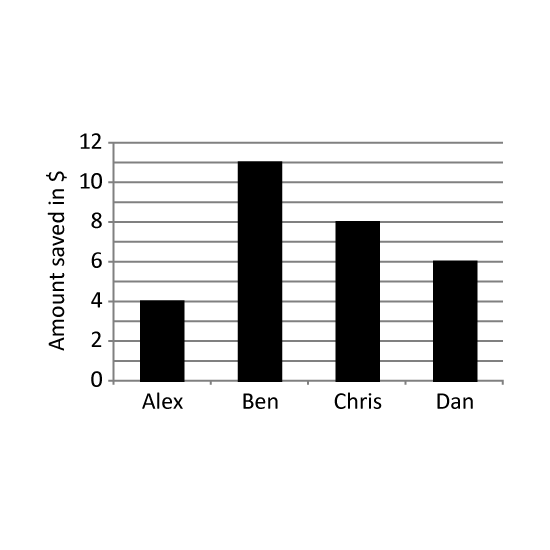
Four friends were given a sum of $25 each. The bar graph shows the amount of money saved by each of them in the week. How much did they spend together?
Level 1
Four friends were given a sum of $25 each. The bar graph shows the amount of money saved by each of them in the week. How much did they spend together?
Level 2
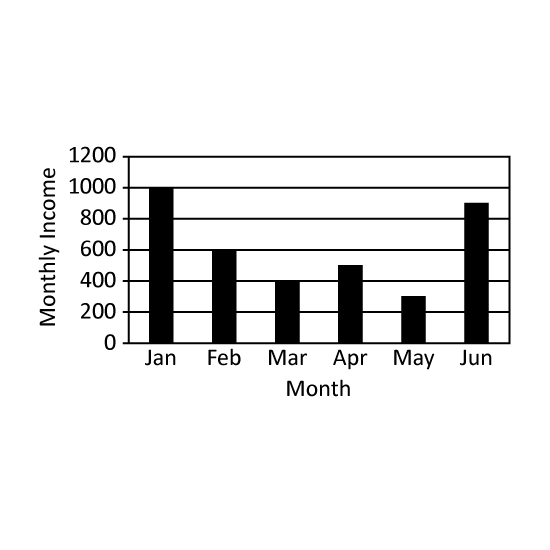
The graph shows the monthly income of Mr Chai for the first half of the year. In which month was his income 35 of her combined income in January and April? Give the answer in short form. (Eg Jan)
Level 2
The graph shows the monthly income of Mr Chai for the first half of the year. In which month was his income 35 of her combined income in January and April? Give the answer in short form. (Eg Jan)
Level 2
Julian has $300. Cole has $200 less than Julian. Mark has $350 more than Cole. Find the ratio of Julian's money to Mark's money to Cole's money.
Level 2
Peggy earns $1800 a month. She spends $720 on food and transport, $630 on entertainment and saves the rest. What percentage of her monthly income does she save?