Level 1
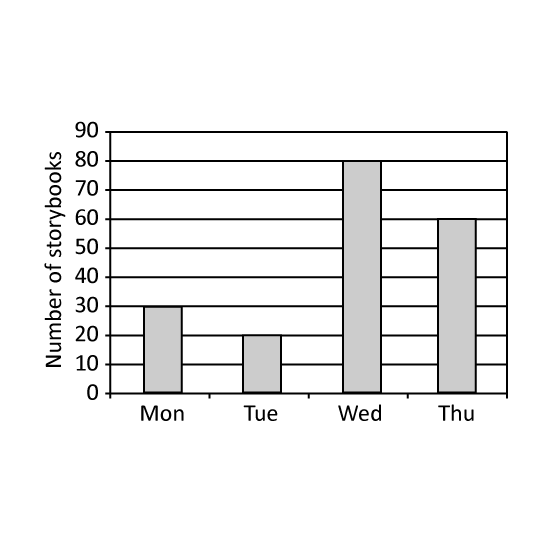
The graph shows the number of story books borrowed from a library over 4 days. What is the total number of story books borrowed from Monday to Thursday?
Level 1
The graph shows the number of story books borrowed from a library over 4 days. What is the total number of story books borrowed from Monday to Thursday?
Level 1
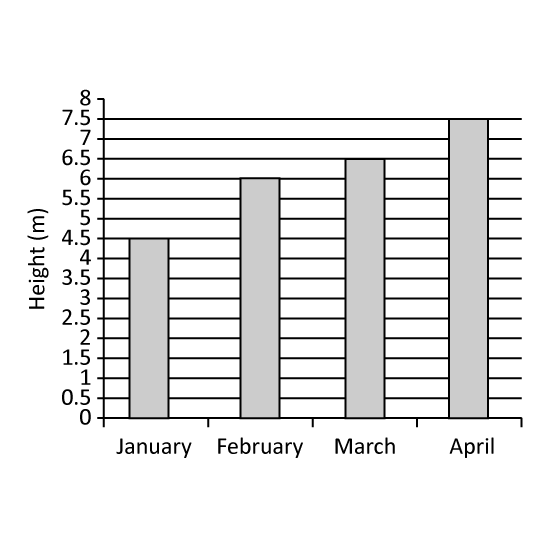
The graph shows the height of a plant on the last day of each month from January to April. In which month was the greatest increase in the plant's plant's height recorded?
Level 1
The graph shows the height of a plant on the last day of each month from January to April. In which month was the greatest increase in the plant's plant's height recorded?
Level 1
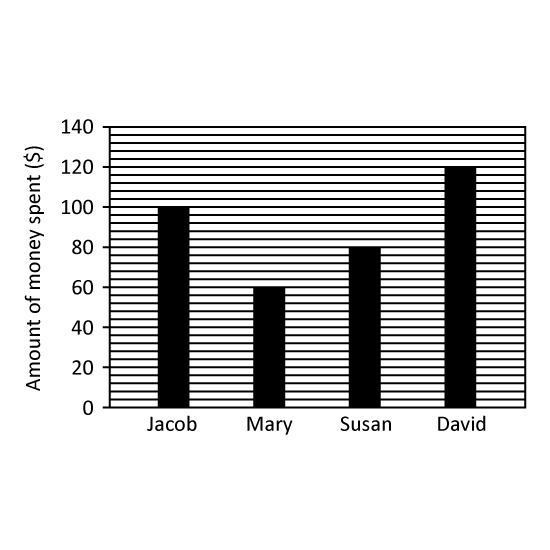
The bar graph shows the amount of money spent by 4 children.
Name the child/children who spent more than $80? Give your answer(s) in number(s). (Eg 1 or 1,2)
Level 1
The bar graph shows the amount of money spent by 4 children.
Name the child/children who spent more than $80? Give your answer(s) in number(s). (Eg 1 or 1,2)