Level 1 PSLE
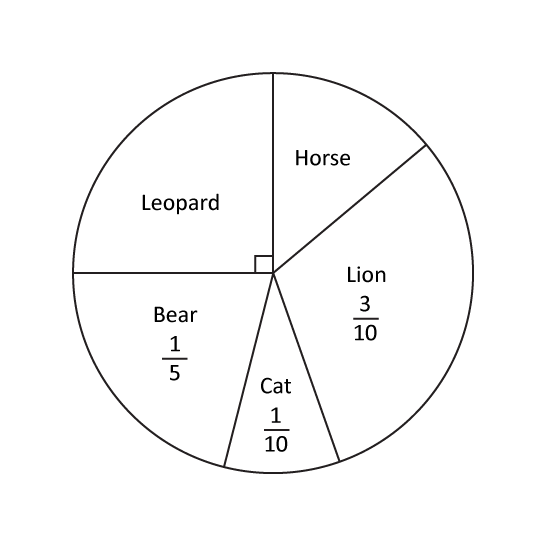
In a class, each pupil chose one animal for their class banner. The pie chart shows their choices. What fraction of the class chose Horse?
Level 1 PSLE
In a class, each pupil chose one animal for their class banner. The pie chart shows their choices. What fraction of the class chose Horse?
Level 2
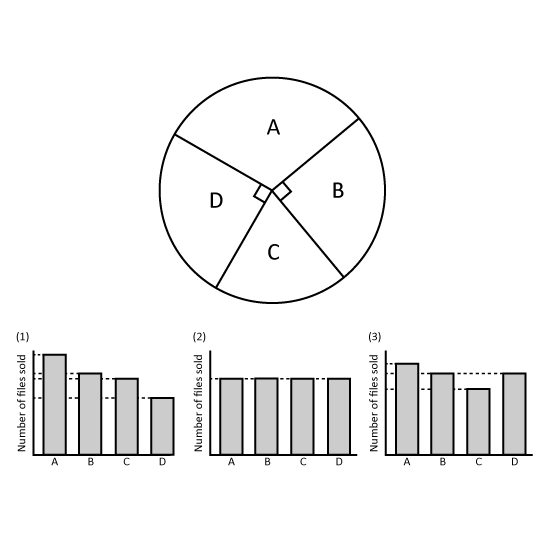
The pie chart shows the number of three types of files sold by a bookstore last week. Which bar graph best represents the information in the pie chart? Give your answer in number. (Eg 1)
Level 2
The pie chart shows the number of three types of files sold by a bookstore last week. Which bar graph best represents the information in the pie chart? Give your answer in number. (Eg 1)
Level 1
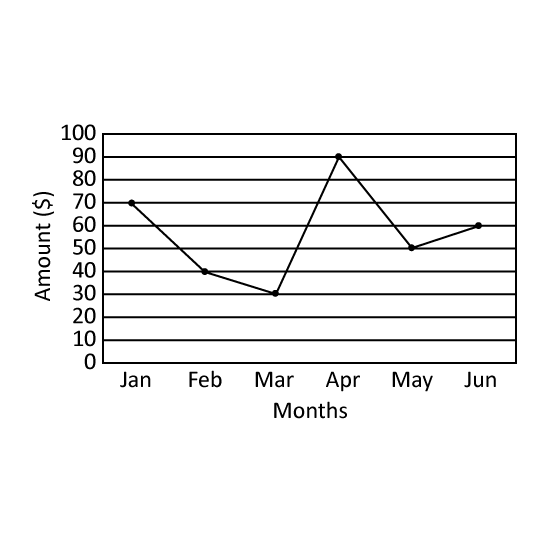
The line graph shows the amount of utility bills paid by Mr Gann's household in the first six months of the year. In which month did the greatest decrease in utility bills occur? Give the answer in short form. (Eg Jan)
Level 1
The line graph shows the amount of utility bills paid by Mr Gann's household in the first six months of the year. In which month did the greatest decrease in utility bills occur? Give the answer in short form. (Eg Jan)