Level 2 PSLE
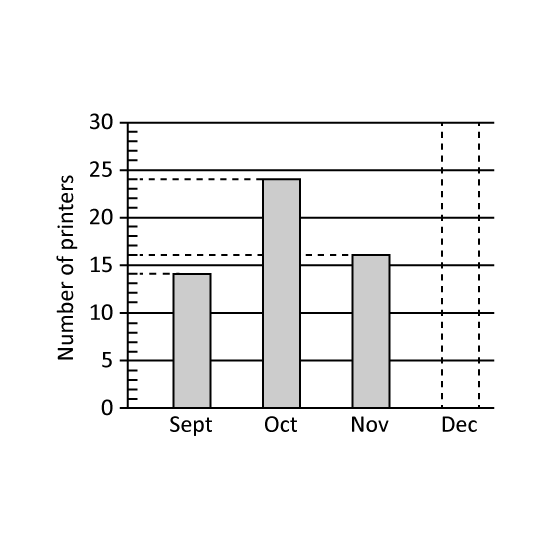
The bar graph shows the number of printers sold by Mr. Owen in 4 months. The bar that shows the number of printers sold in December has not been drawn. The number of printers sold in October was 30% of the total number of printers sold in the 4 months.
What was the total number of printers sold in the 4 months?
What was the number of printers sold in December?
Level 2 PSLE
The bar graph shows the number of printers sold by Mr. Owen in 4 months. The bar that shows the number of printers sold in December has not been drawn. The number of printers sold in October was 30% of the total number of printers sold in the 4 months.
What was the total number of printers sold in the 4 months?
Level 2 PSLE
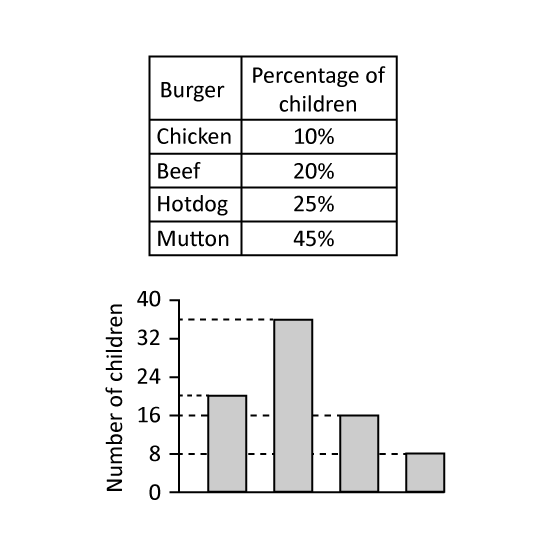
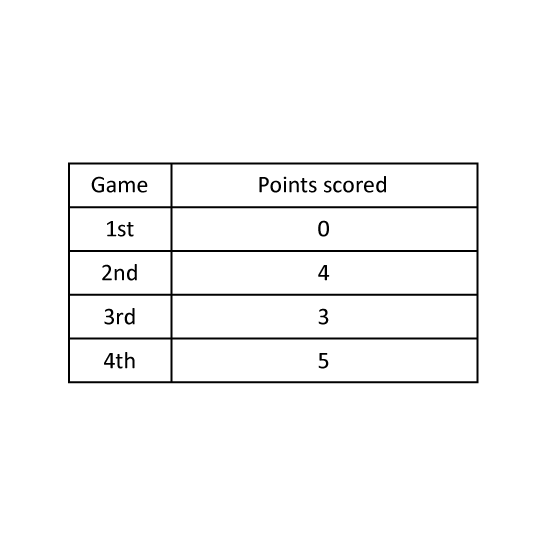
A group of children was asked to choose one burger from chicken, beef, hotdog and mutton. The table represents the children's choices. The children's choices were also represented by a bar graph but the names of the burger were not shown. What was the total number of children who chose chicken and hotdog burgers?
Level 2 PSLE
A group of children was asked to choose one burger from chicken, beef, hotdog and mutton. The table represents the children's choices. The children's choices were also represented by a bar graph but the names of the burger were not shown. What was the total number of children who chose chicken and hotdog burgers?
Level 1
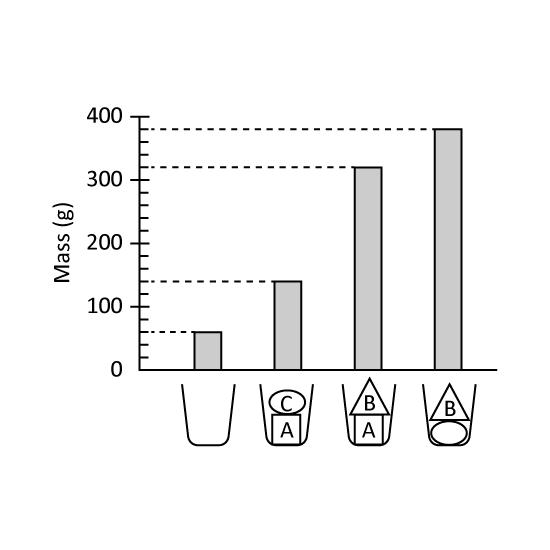
There are 3 boxes. The mass of Box A is 3.4 kg, the mass of Box B is 5.8 kg and the mass of Box C is 4.2 kg. Which box has its mass nearest to the average mass of the 3 boxes? Give the letter only for the answer.
Level 2 PSLE
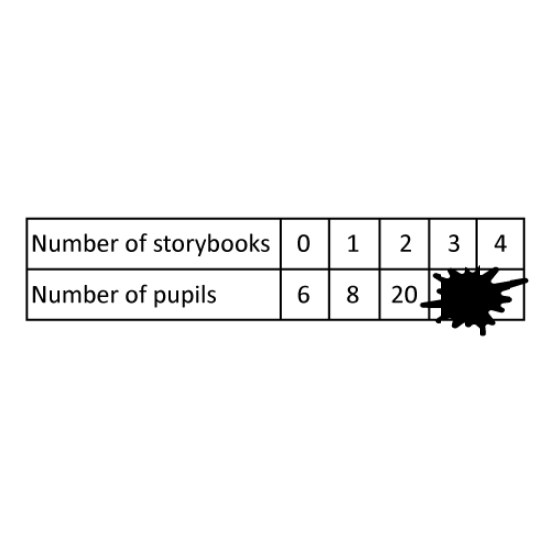
The table shows the number of storybooks read by each pupil in a group. Part of the table is covered by an ink blot. There were 43 pupils who read at least 2 storybooks.
How many pupils who read more than 2 storybooks?
How many pupils are in the group?
Level 2 PSLE
The table shows the number of storybooks read by each pupil in a group. Part of the table is covered by an ink blot. There were 43 pupils who read at least 2 storybooks.