Level 1 PSLE
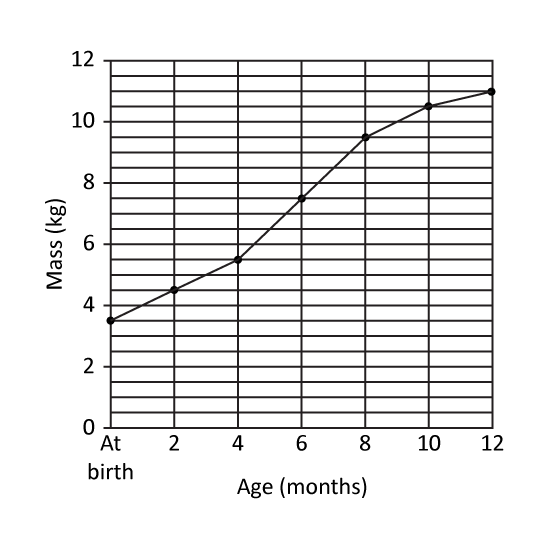
The line graph shows Kenneth's mass from birth to his first birthday. At what age was Kenneth's mass 3 times his mass at birth? _____ months
Level 1 PSLE
The line graph shows Kenneth's mass from birth to his first birthday. At what age was Kenneth's mass 3 times his mass at birth? _____ months
Level 1 PSLE
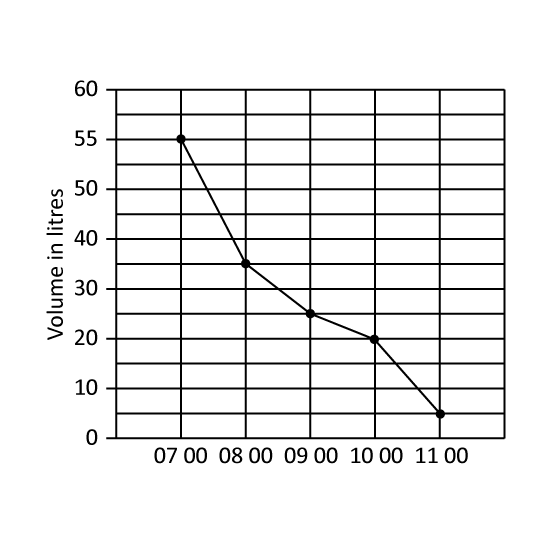
A tank was filled with 55 litre of water at 07 00. Water flowed out of the tank from 07 00 to 11 00. The line graph shows the amount of water in the tank from 07 00 to 11 00.
During which one-hour period was the decrease in the volume of water the greatest?
Give your answer in number. (Eg 1)
(1) From 0700 to 0800
(2) From 0700 to 0900
(3) From 0900 to 1000
(4) From 1000 to 1100
Level 1 PSLE
A tank was filled with 55 litre of water at 07 00. Water flowed out of the tank from 07 00 to 11 00. The line graph shows the amount of water in the tank from 07 00 to 11 00.
During which one-hour period was the decrease in the volume of water the greatest?
Give your answer in number. (Eg 1)
(1) From 0700 to 0800
(2) From 0700 to 0900
(3) From 0900 to 1000
(4) From 1000 to 1100
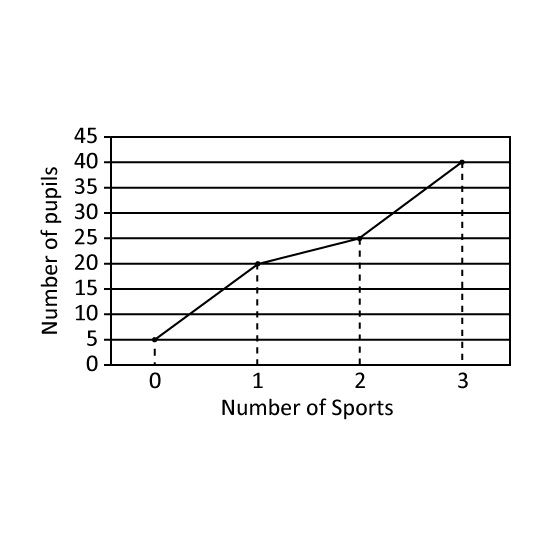
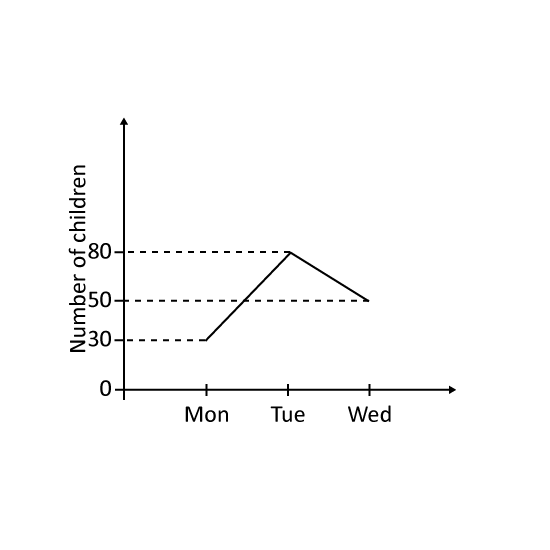
Level 1 PSLE The graph shows the number of children at the camp from Monday to Wednesday. The number of children at a club increased by (a) _____ from Monday to Tuesday and decreased by (b) _____ from Tuesday to Wednesday.
Level 1 PSLE The graph shows the number of children at the camp from Monday to Wednesday. The number of children at a club increased by (a) _____ from Monday to Tuesday and decreased by (b) _____ from Tuesday to Wednesday.
Level 3
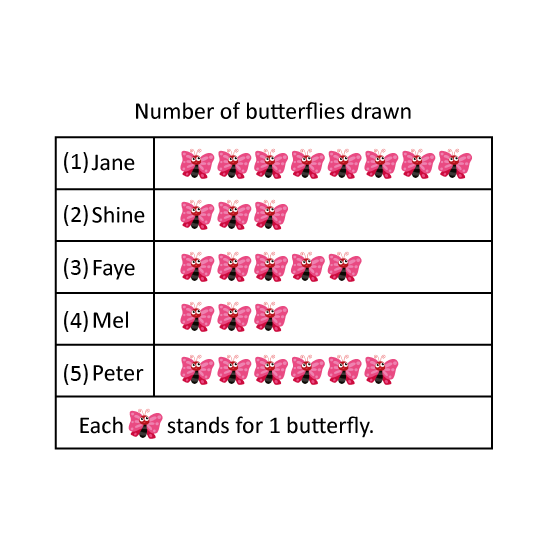
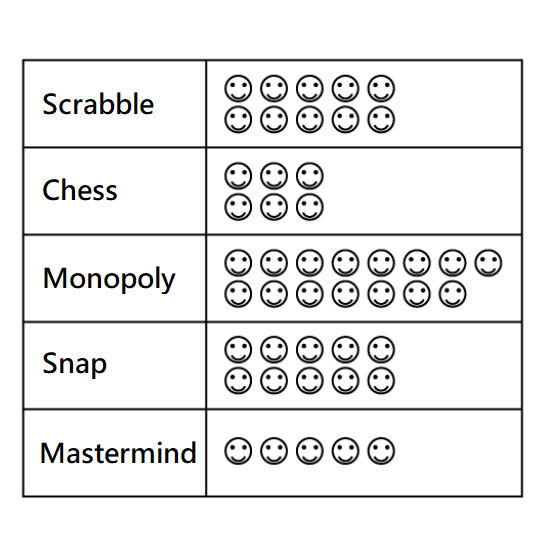
Look at the picture graph.
This graph shows the favourite board games of a group of children. Each smiley stands for 1 child. Give the answers in numbers.
_____ children like Scrabble.
5 more children prefer Snap to _____.
_____ fewer children prefer chess to Monopoly.
The same number of children like _____ and _____. (Eg 1, 2)
Level 3
Look at the picture graph.
This graph shows the favourite board games of a group of children. Each smiley stands for 1 child. Give the answers in numbers.
_____ children like Scrabble.
5 more children prefer Snap to _____.
_____ fewer children prefer chess to Monopoly.
The same number of children like _____ and _____. (Eg 1, 2)