Level 1
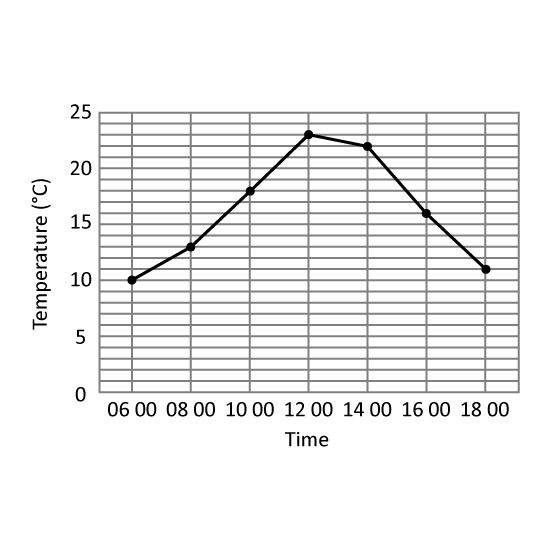
The table shows the temperature change in Hillview Town.
At which 2 hour-interval of the day was there the greatest change in temperature? Give your answer in this format. (Eg 1200 to 1400)
Level 1
The table shows the temperature change in Hillview Town.
At which 2 hour-interval of the day was there the greatest change in temperature? Give your answer in this format. (Eg 1200 to 1400)
Level 2
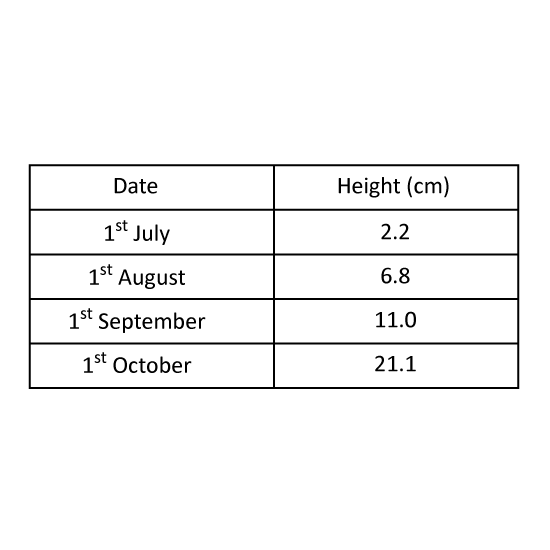
The table shows the height of a plant in centimetres on the first day of each month from July to October. In which month did the plant's height increase the most? Give your answer in this format. (Eg Jan)
Level 2
The table shows the height of a plant in centimetres on the first day of each month from July to October. In which month did the plant's height increase the most? Give your answer in this format. (Eg Jan)