Level 1
During a donation drive, Lisa and her 4 friends collected a total of $5160 in six weeks. What was the average amount each of them collected in a week?
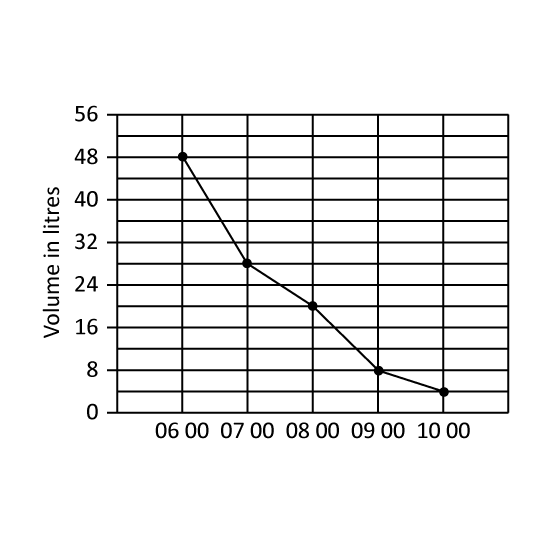
Level 1 PSLE A tank was filled with 48 litres of water at 06 00. Water flowed out of the tank from 06 00 to 11 00. The line graph shows the amount of water in the tank from 06 00 to 10 00. What was the average decrease in the volume of water in litres per hour from 06 00 to 10 00? (Give your answer in ℓ.)
Level 1 PSLE A tank was filled with 48 litres of water at 06 00. Water flowed out of the tank from 06 00 to 11 00. The line graph shows the amount of water in the tank from 06 00 to 10 00. What was the average decrease in the volume of water in litres per hour from 06 00 to 10 00? (Give your answer in ℓ.)
Level 1
A tiger eats an average of 28 kg of meat per day, while a lion eats an average of 30.5 kg of meat per day. How much more meat than the tiger will the lion eat in a week?
Level 1 PSLE
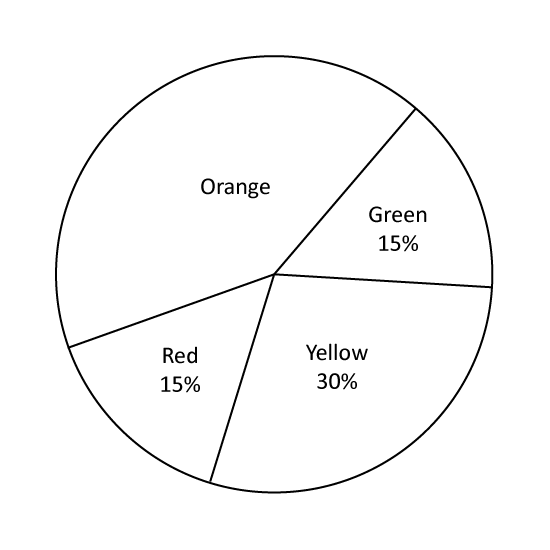
A group of 200 pupils was asked to name their favourite sports. The pie chart shows their choices and the number of pupils who chose each of the sports. Which sports was chosen by 25% of the pupils? Give the answer in letter.
Level 1 PSLE
A group of 200 pupils was asked to name their favourite sports. The pie chart shows their choices and the number of pupils who chose each of the sports. Which sports was chosen by 25% of the pupils? Give the answer in letter.