Level 1 PSLE
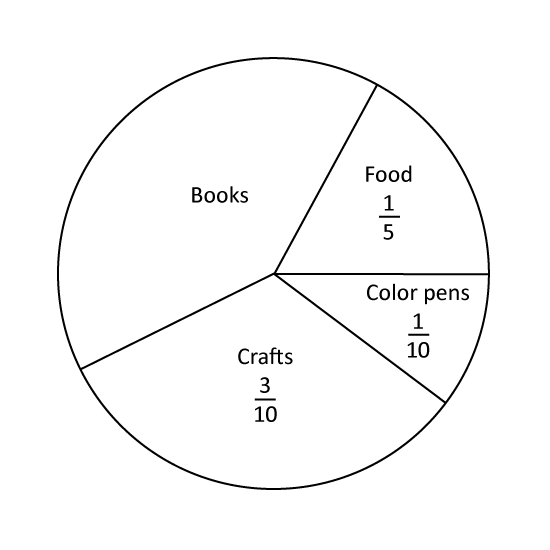
The pie chart shows how Jenny spent her pocket money last month. What is the ratio of the amount of money Jenny spent on crafts to the amount she spent on books?
Level 1 PSLE
The pie chart shows how Jenny spent her pocket money last month. What is the ratio of the amount of money Jenny spent on crafts to the amount she spent on books?
Image in this question is not available.
Level 1
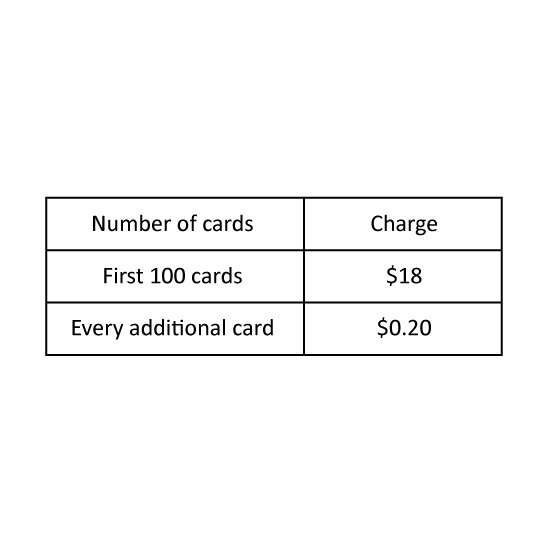
The charges for printing invitation cards are as follows:
How much does it cost to print 300 cards?
Level 1
The charges for printing invitation cards are as follows:
How much does it cost to print 300 cards?
Image in this question is not available.
Level 1 PSLE
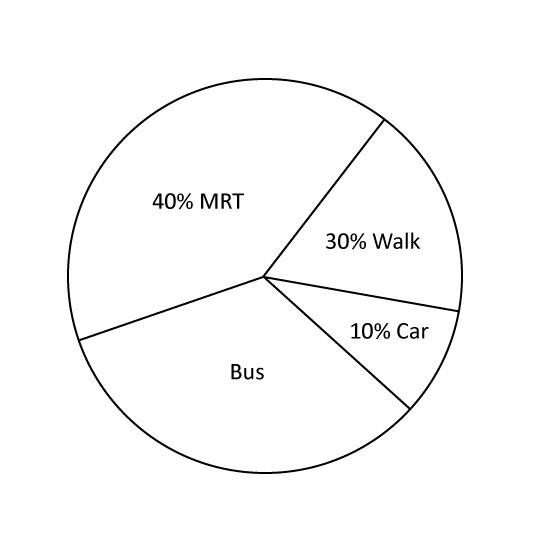
The pie chart shows the different ways a group of workers go to work. What is the ratio of number of workers who walk to work to the number who go by bus?
Level 1 PSLE
The pie chart shows the different ways a group of workers go to work. What is the ratio of number of workers who walk to work to the number who go by bus?
Image in this question is not available.
Level 2 PSLE
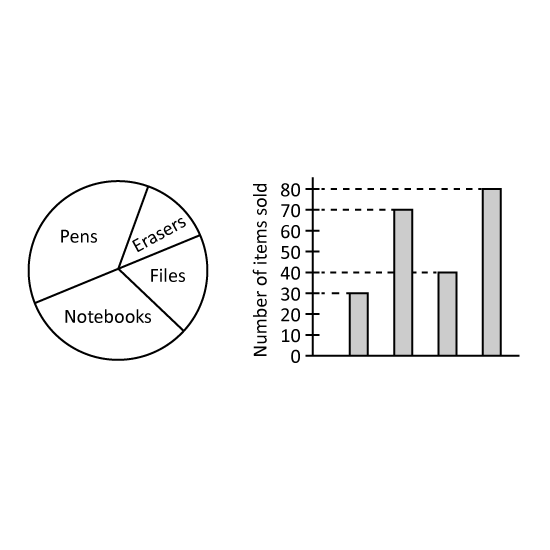
The pie chart shows the number of pens, erasers, file and notebook sold by a shop. The same information is shown in a bar graph, but the names of the items are not shown on the bar graph.
How many less erasers than pens are sold?
Level 2 PSLE
The pie chart shows the number of pens, erasers, file and notebook sold by a shop. The same information is shown in a bar graph, but the names of the items are not shown on the bar graph.
How many less erasers than pens are sold?
Image in this question is not available.
Level 1
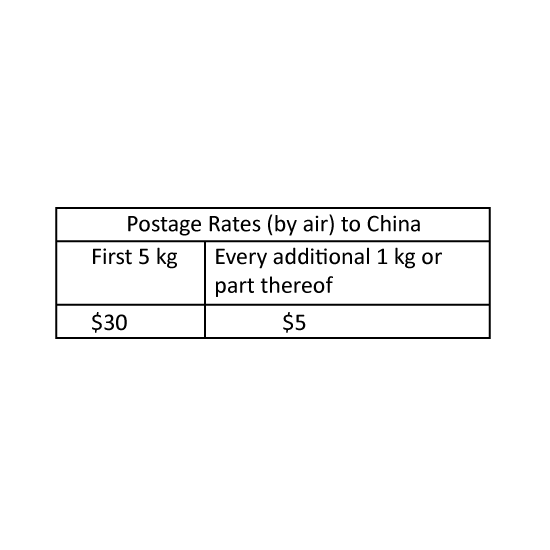
The table shows the postage rates of shipping parcels by sea to America. Yancy sent a 15 kg 750 g parcel to his cousin in America by sea. How much did he pay?
Level 1
The table shows the postage rates of shipping parcels by sea to America. Yancy sent a 15 kg 750 g parcel to his cousin in America by sea. How much did he pay?
Image in this question is not available.
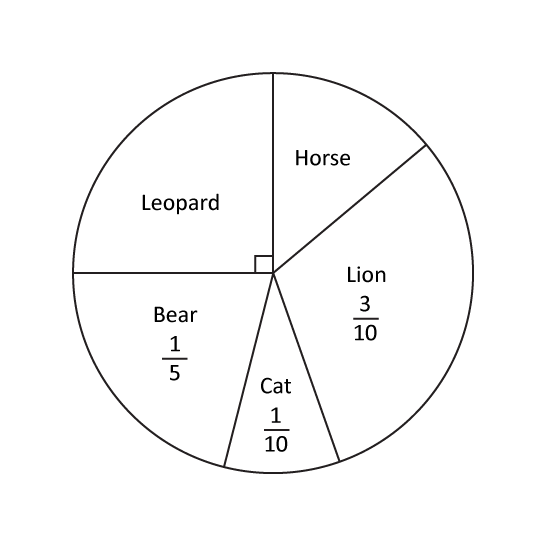
Level 1 PSLE
In a class, each pupil chose one animal for their class banner. The pie chart shows their choices. What fraction of the class chose Horse?
Level 1 PSLE
In a class, each pupil chose one animal for their class banner. The pie chart shows their choices. What fraction of the class chose Horse?
Image in this question is not available.
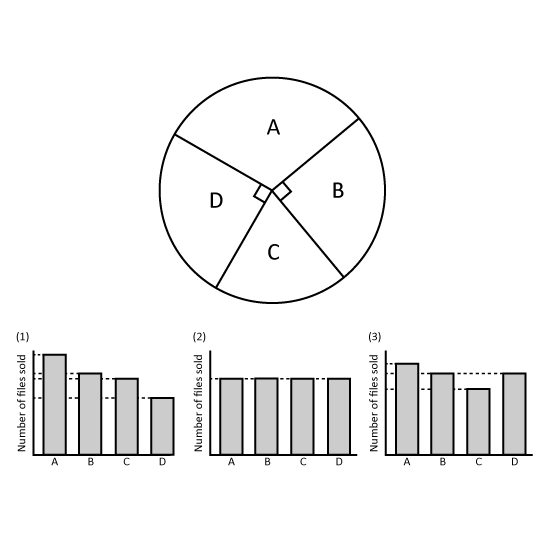
Level 2
The pie chart shows the number of three types of files sold by a bookstore last week. Which bar graph best represents the information in the pie chart? Give your answer in number. (Eg 1)
Level 2
The pie chart shows the number of three types of files sold by a bookstore last week. Which bar graph best represents the information in the pie chart? Give your answer in number. (Eg 1)
Image in this question is not available.
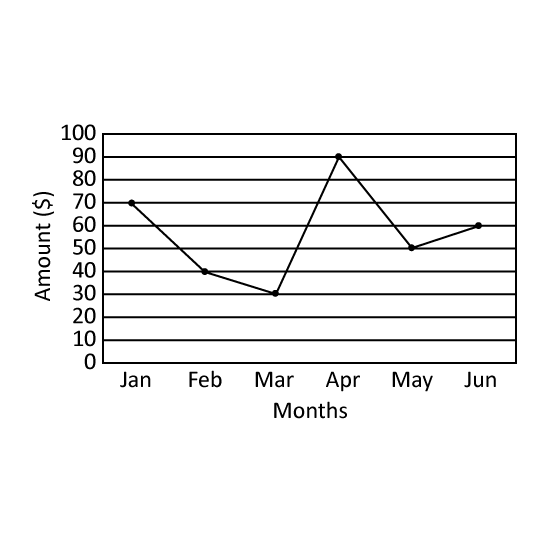
Level 1
The line graph shows the amount of utility bills paid by Mr Gann's household in the first six months of the year. In which month did the greatest decrease in utility bills occur? Give the answer in short form. (Eg Jan)
Level 1
The line graph shows the amount of utility bills paid by Mr Gann's household in the first six months of the year. In which month did the greatest decrease in utility bills occur? Give the answer in short form. (Eg Jan)
Image in this question is not available.
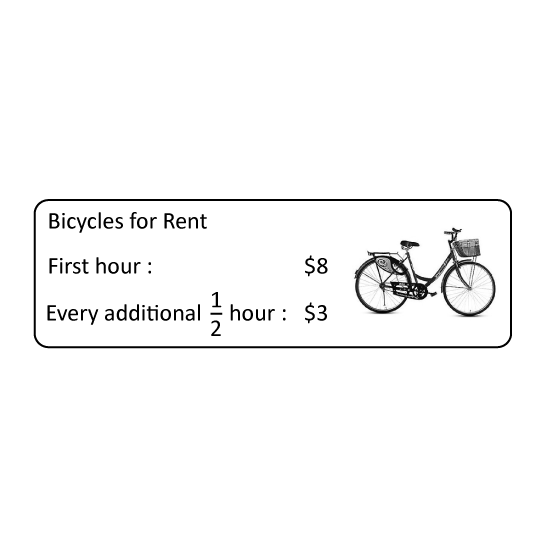
Level 1 PSLE
The table shows the charges for bicycle rental. Colin rented a bicycle for 3 hours. How much did he pay?
Level 1 PSLE
The table shows the charges for bicycle rental. Colin rented a bicycle for 3 hours. How much did he pay?
Image in this question is not available.
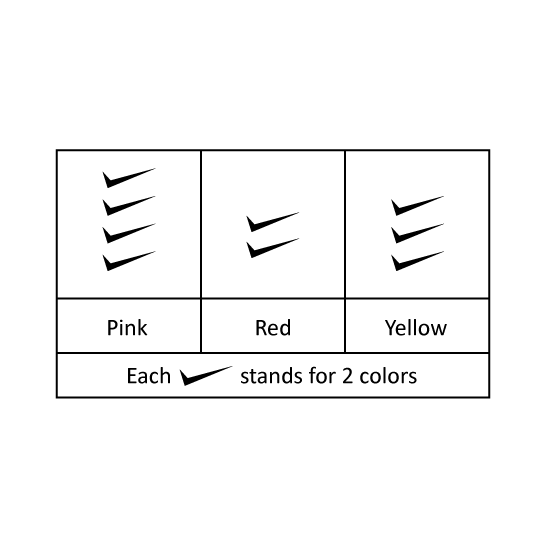
Level 2
The graph shows the favourite color of girls in a class. Study the graph and answer the following.
- If 4 girls like red, how many girls does each (/) stand?
- How many girls are there altogether in the class?
Level 2
The graph shows the favourite color of girls in a class. Study the graph and answer the following.
- If 4 girls like red, how many girls does each (/) stand?
- How many girls are there altogether in the class?
Image in this question is not available.