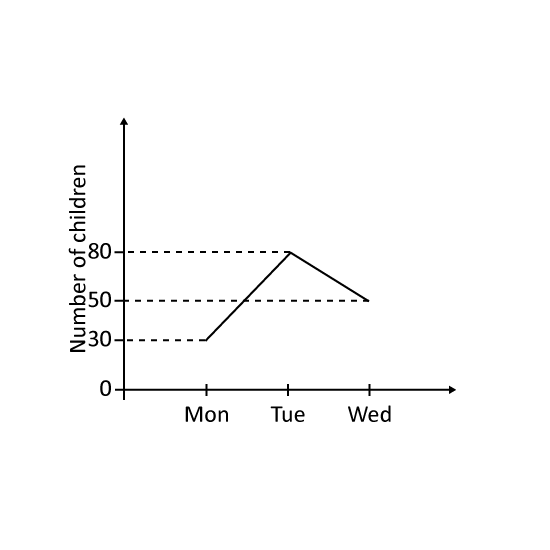
Level 1 PSLE The graph shows the number of children at the camp from Monday to Wednesday. The number of children at a club increased by (a) _____ from Monday to Tuesday and decreased by (b) _____ from Tuesday to Wednesday.
Level 1 PSLE The graph shows the number of children at the camp from Monday to Wednesday. The number of children at a club increased by (a) _____ from Monday to Tuesday and decreased by (b) _____ from Tuesday to Wednesday.
Level 3
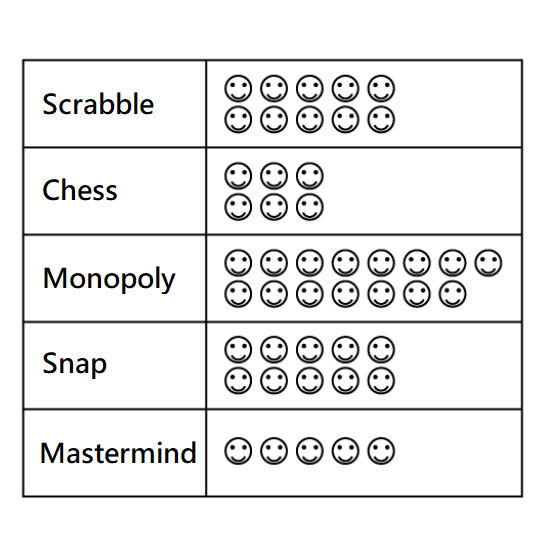
Look at the picture graph.
This graph shows the favourite board games of a group of children. Each smiley stands for 1 child. Give the answers in numbers.
_____ children like Scrabble.
5 more children prefer Snap to _____.
_____ fewer children prefer chess to Monopoly.
The same number of children like _____ and _____. (Eg 1, 2)
Level 3
Look at the picture graph.
This graph shows the favourite board games of a group of children. Each smiley stands for 1 child. Give the answers in numbers.
_____ children like Scrabble.
5 more children prefer Snap to _____.
_____ fewer children prefer chess to Monopoly.
The same number of children like _____ and _____. (Eg 1, 2)