Level 2
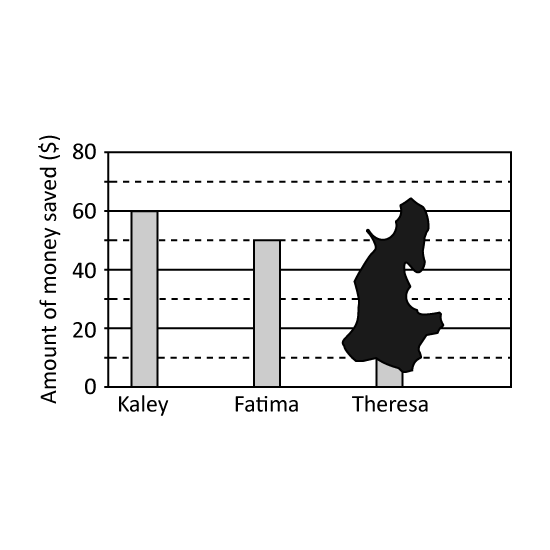
The bar graph shows the amount of money saved by 3 children in Jun.
Part of the graph had been blotted with ink. The total amount saved by the 3 children in June was $145.
Who saved more money, Fatima or Theresa? Give your answer in number. (Eg 1)
How much more did this child save?
Level 2
The bar graph shows the amount of money saved by 3 children in Jun.
Part of the graph had been blotted with ink. The total amount saved by the 3 children in June was $145.
Who saved more money, Fatima or Theresa? Give your answer in number. (Eg 1)
Level 2
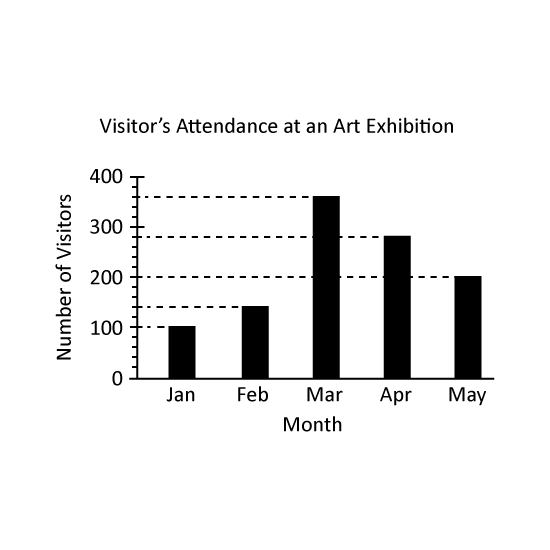
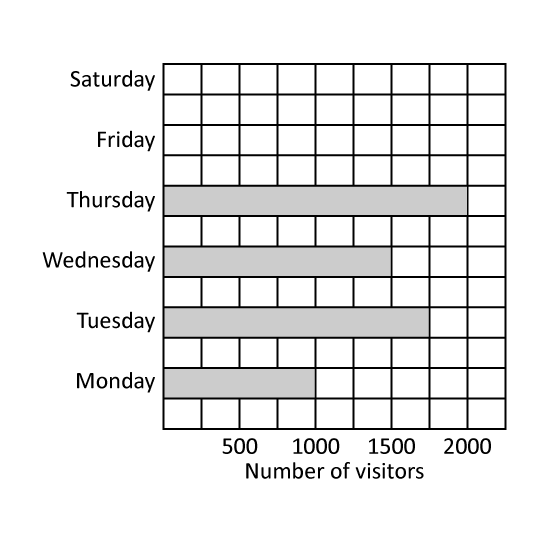
The graph shows the number of visitors who attended an art exhibition over five months. Which month has twice the number of visitors in January? Give your answer in this format. (Eg Jan)
Level 2
The graph shows the number of visitors who attended an art exhibition over five months. Which month has twice the number of visitors in January? Give your answer in this format. (Eg Jan)
Level 2
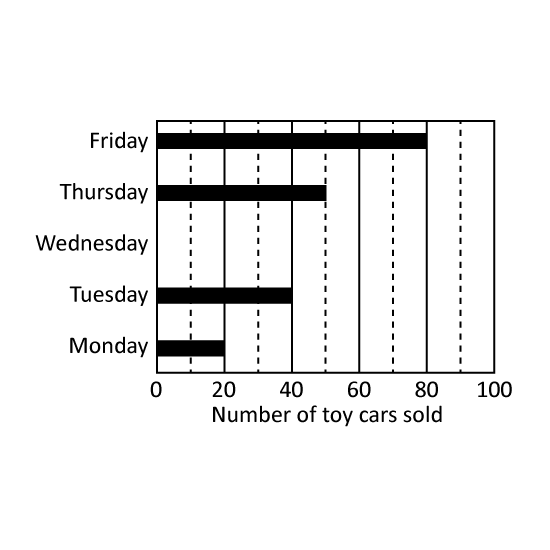
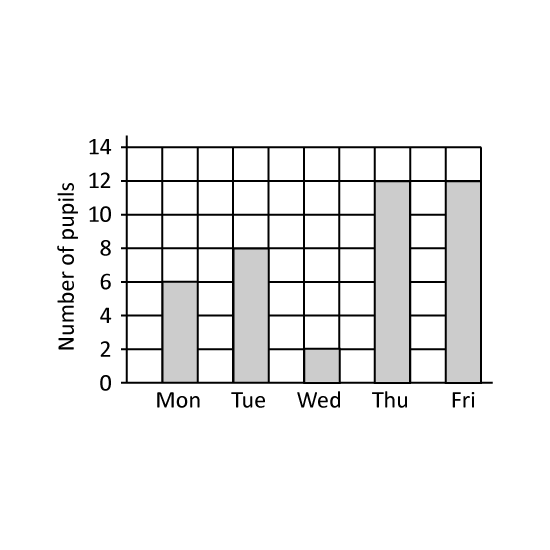
The graph shows the number of visitors to the museum. On which days were there twice as many visitors as on Monday? Give the answer in short form. (Eg Mon)
Level 2
The graph shows the number of visitors to the museum. On which days were there twice as many visitors as on Monday? Give the answer in short form. (Eg Mon)
Level 2
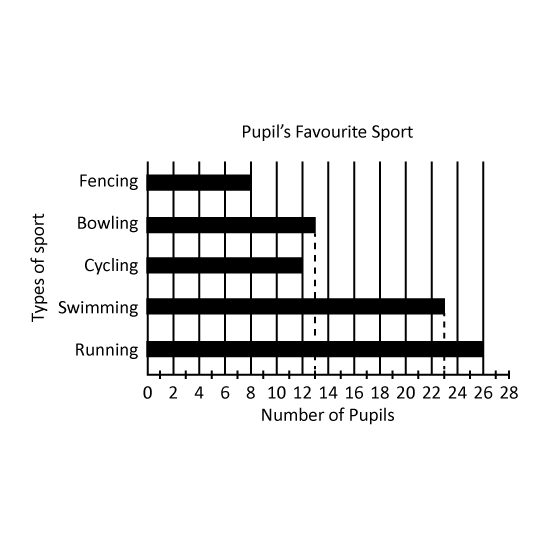
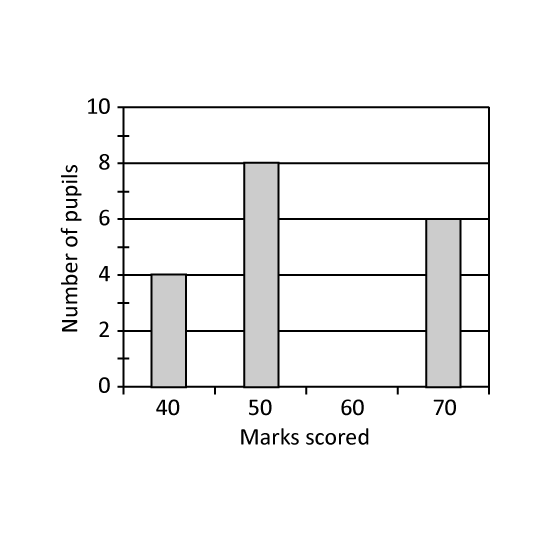
The bar graph shows the exam results of a group of pupils. How many pupils who scored 60 marks, given that 12 of the pupils scored 50 marks and below.
Level 2
The bar graph shows the exam results of a group of pupils. How many pupils who scored 60 marks, given that 12 of the pupils scored 50 marks and below.
Level 2
The graph shows the number of visitors to the amusement park. 2 times as many visitors visited the amusement park on Friday as on Monday. How many visitors visited the amusement park on Friday?
Level 2
The graph shows the number of visitors to the amusement park. 2 times as many visitors visited the amusement park on Friday as on Monday. How many visitors visited the amusement park on Friday?
Level 2
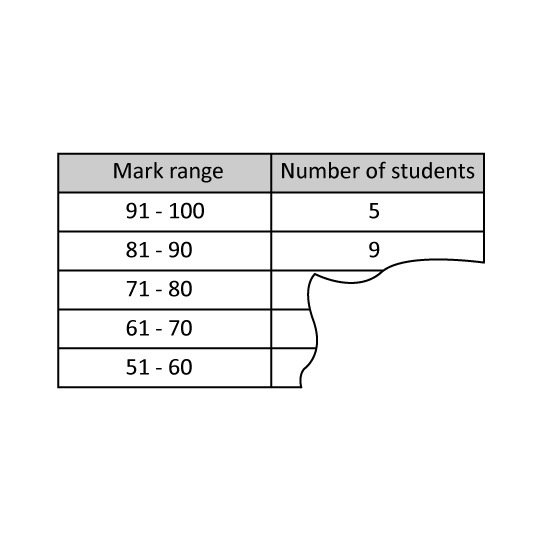
Part of the table was accidentally torn off. The table shows the number of students from class 4C scoring within various mark ranges in a Mathematics test. 35 students scored above 70 marks. How many students scored in the mark range 71 - 80?
Level 2
Part of the table was accidentally torn off. The table shows the number of students from class 4C scoring within various mark ranges in a Mathematics test. 35 students scored above 70 marks. How many students scored in the mark range 71 - 80?