Level 1
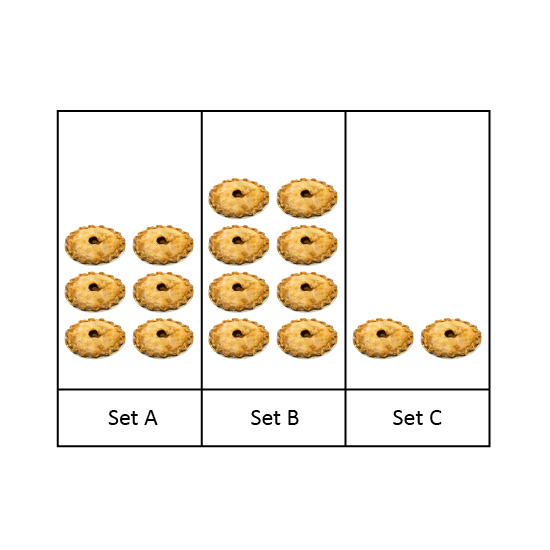
Compare the three sets. Give the answer in letters. (Eg 1)
Set 1 has fewer pies than Set _____.
Level 1
Compare the three sets. Give the answer in letters. (Eg 1)
Set 1 has fewer pies than Set _____.
Image in this question is not available.
Level 2
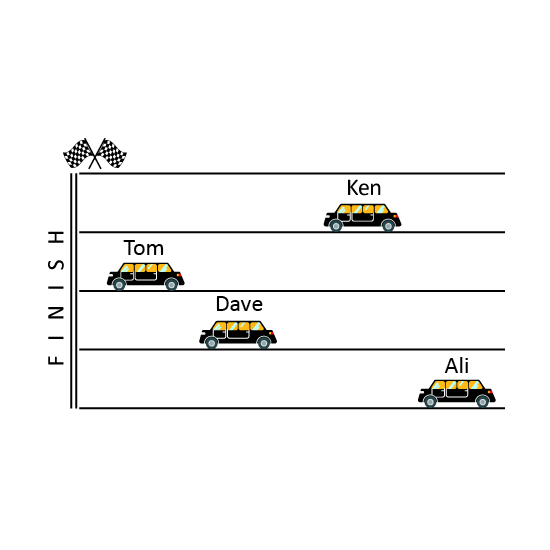
Look at the picture. Give the answers in numbers. (Eg 1)
- Who is in the 1st position?
- Who is behind Ken?
- Who is between Tom and Ken?
- Who is in the last position?
Level 2
Look at the picture. Give the answers in numbers. (Eg 1)
- Who is in the 1st position?
- Who is behind Ken?
- Who is between Tom and Ken?
- Who is in the last position?
Image in this question is not available.
Level 2
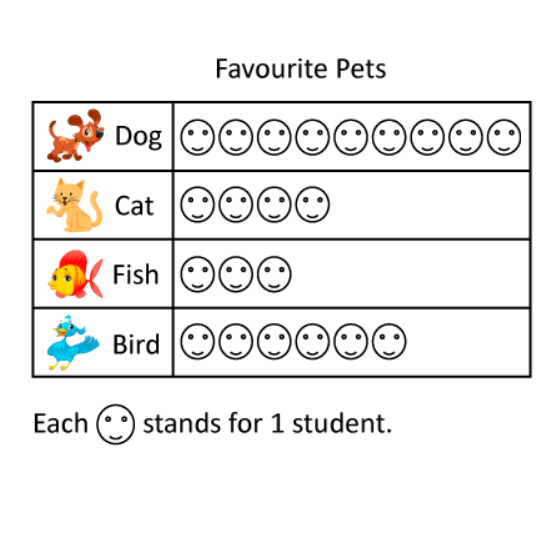
Look at the picture graph.
This graph shows 4 favourite pets that students like. Give the answers in numbers. (Eg 1)
- What is the most popular pet?
- What is the least popular pet?
- How many students like birds and dogs?
- How many students are there altogether?
Level 2
Look at the picture graph.
This graph shows 4 favourite pets that students like. Give the answers in numbers. (Eg 1)
- What is the most popular pet?
- What is the least popular pet?
- How many students like birds and dogs?
- How many students are there altogether?
Image in this question is not available.
Level 2
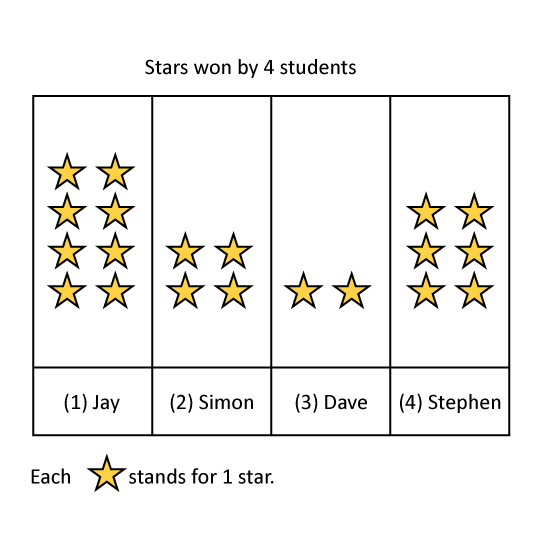
Look at the picture graph.
This graph shows the number of stars won by 4 students.
- Who won the most number of stars?
- Who won the least number of stars?
- How many stars did the 4 students win altogether?
- How many more stars did Joe win than Sandy?
Level 2
Look at the picture graph.
This graph shows the number of stars won by 4 students.
- Who won the most number of stars?
- Who won the least number of stars?
- How many stars did the 4 students win altogether?
- How many more stars did Joe win than Sandy?
Image in this question is not available.
Level 2
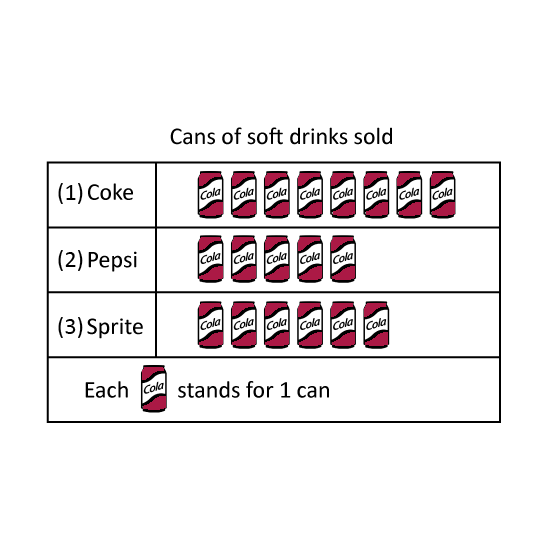
Look at the picture graph.
This graph shows the number of soft drinks that Tom sold.
- Which soft drink is the least popular?
- How many more cans of Coke than Pepsi did he sell?
- How many cans of soft drinks did he sell altogether?
Level 2
Look at the picture graph.
This graph shows the number of soft drinks that Tom sold.
- Which soft drink is the least popular?
- How many more cans of Coke than Pepsi did he sell?
- How many cans of soft drinks did he sell altogether?
Image in this question is not available.
Level 1
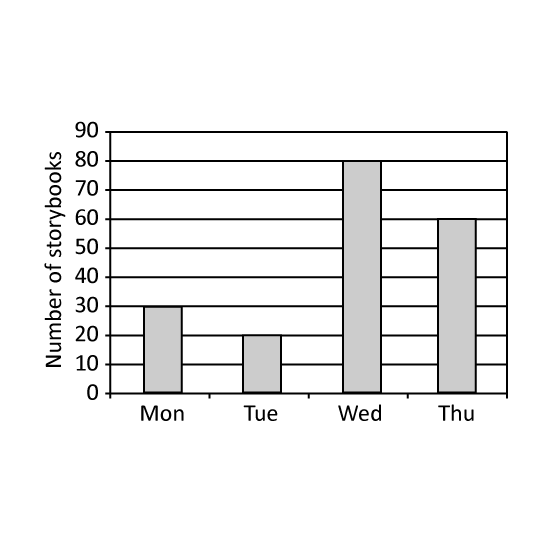
The graph shows the number of story books borrowed from a library over 4 days. What is the total number of story books borrowed from Monday to Thursday?
Level 1
The graph shows the number of story books borrowed from a library over 4 days. What is the total number of story books borrowed from Monday to Thursday?
Image in this question is not available.
Level 1
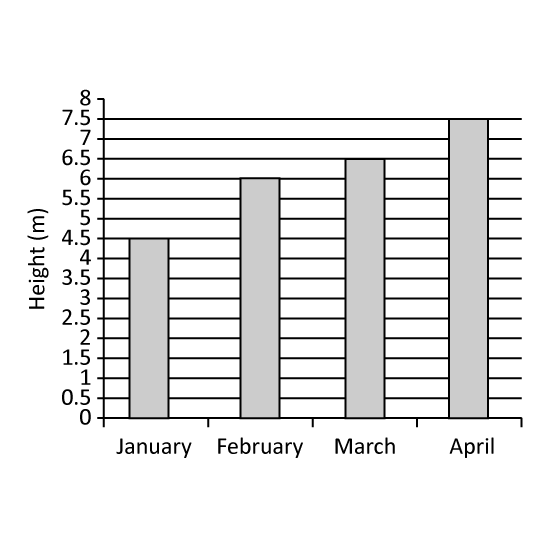
The graph shows the height of a plant on the last day of each month from January to April. In which month was the greatest increase in the plant's plant's height recorded?
Level 1
The graph shows the height of a plant on the last day of each month from January to April. In which month was the greatest increase in the plant's plant's height recorded?
Image in this question is not available.
Level 1
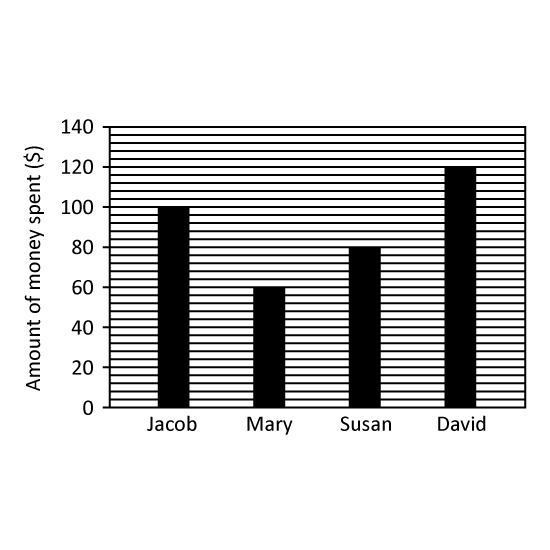
The bar graph shows the amount of money spent by 4 children.
Name the child/children who spent more than $80? Give your answer(s) in number(s). (Eg 1 or 1,2)
Level 1
The bar graph shows the amount of money spent by 4 children.
Name the child/children who spent more than $80? Give your answer(s) in number(s). (Eg 1 or 1,2)
Image in this question is not available.
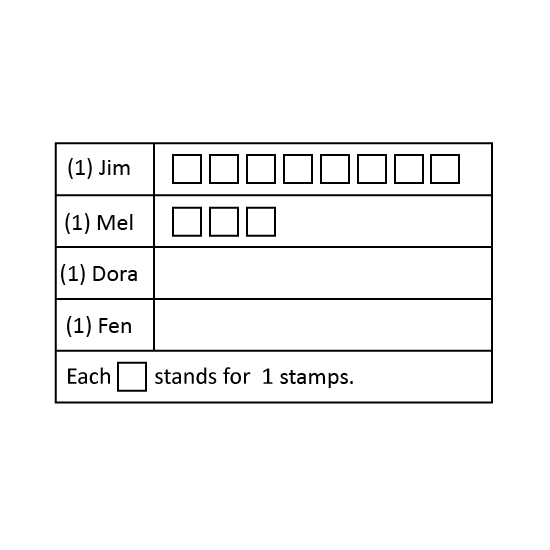
Level 2
Look at the picture graph.
This graph shows the number of postcards 4 children have.
- Dora has 3 postcards more than Mel. How many postcards does Dora have?
- Fen has 2 postcards less than Jim. How many postcards does Fen draw?
- How many postcard do the 4 children have altogether?
Level 2
Look at the picture graph.
This graph shows the number of postcards 4 children have.
- Dora has 3 postcards more than Mel. How many postcards does Dora have?
- Fen has 2 postcards less than Jim. How many postcards does Fen draw?
- How many postcard do the 4 children have altogether?
Image in this question is not available.
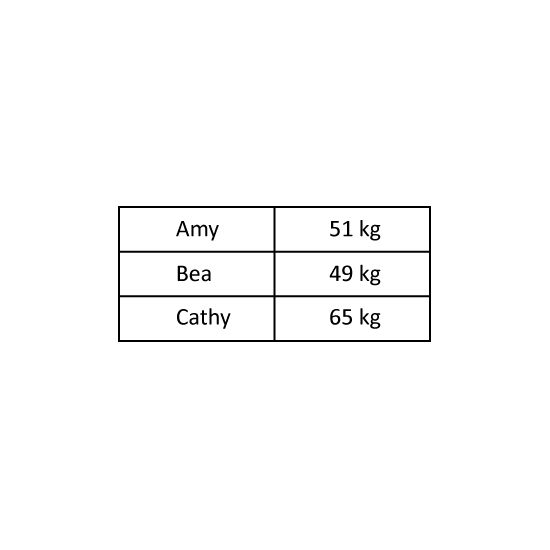
Level 1
The table shows the mass of three girls. What is the total mass of the three girls?
Level 1
The table shows the mass of three girls. What is the total mass of the three girls?
Image in this question is not available.
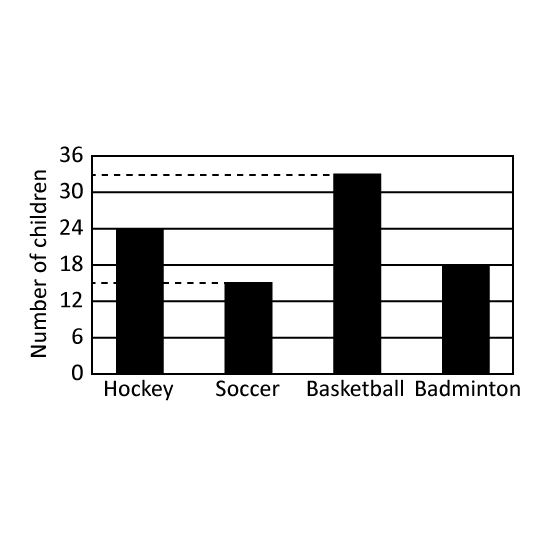
Level 1
The graph shows the types of sports that children play in a primary school. What percentage of the children play badminton?
Level 1
The graph shows the types of sports that children play in a primary school. What percentage of the children play badminton?
Image in this question is not available.
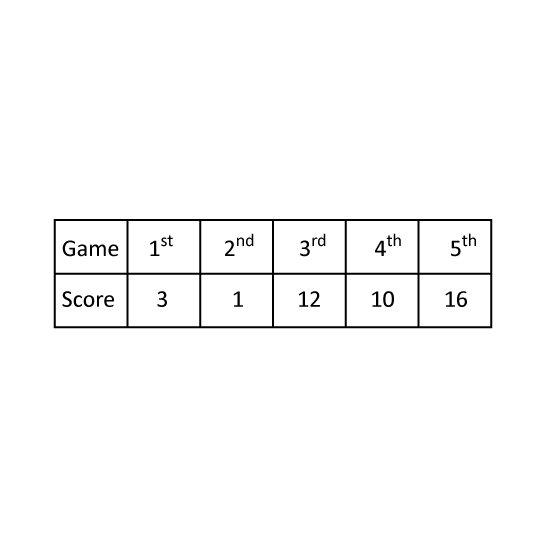
Level 1
David's scores for 5 games are shown in the table. Find this average score.
Level 1
David's scores for 5 games are shown in the table. Find this average score.
Image in this question is not available.
Level 2
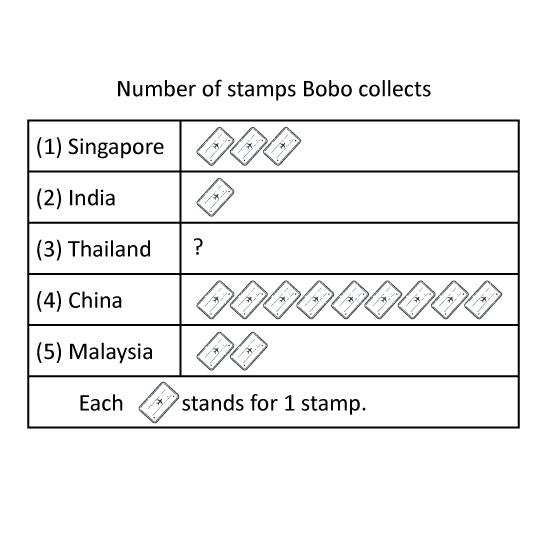
Look at the picture graph.
This graph shows the number of stamps that Bobo collects from 5 countries. He collects a total of 20 stamps.
- Bobo has _____ Singapore and India stamps.
- Bobo has _____ more China stamps than Malaysia stamps.
- Bobo has _____ Thailand stamps.
- Bobo has the greatest collection of _____ stamps. Give the answer in number. (Eg 1)
Level 2
Look at the picture graph.
This graph shows the number of stamps that Bobo collects from 5 countries. He collects a total of 20 stamps.
- Bobo has _____ Singapore and India stamps.
- Bobo has _____ more China stamps than Malaysia stamps.
- Bobo has _____ Thailand stamps.
- Bobo has the greatest collection of _____ stamps. Give the answer in number. (Eg 1)
Image in this question is not available.
Level 1
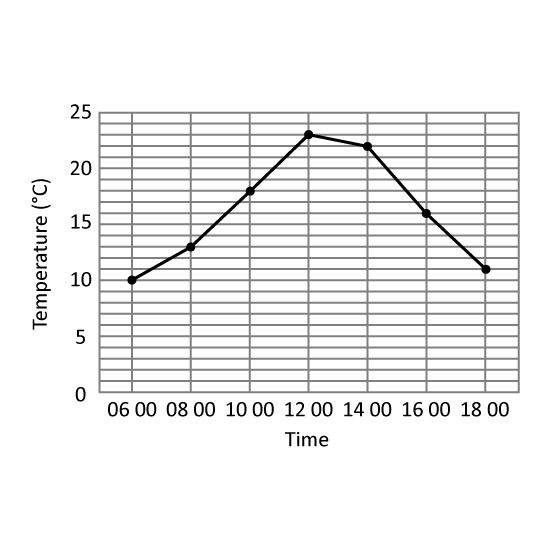
The table shows the temperature change in Hillview Town.
At which 2 hour-interval of the day was there the greatest change in temperature? Give your answer in this format. (Eg 1200 to 1400)
Level 1
The table shows the temperature change in Hillview Town.
At which 2 hour-interval of the day was there the greatest change in temperature? Give your answer in this format. (Eg 1200 to 1400)
Image in this question is not available.
Level 2
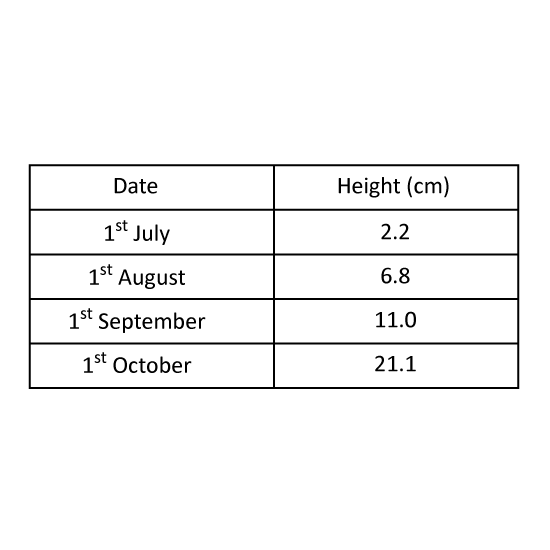
The table shows the height of a plant in centimetres on the first day of each month from July to October. In which month did the plant's height increase the most? Give your answer in this format. (Eg Jan)
Level 2
The table shows the height of a plant in centimetres on the first day of each month from July to October. In which month did the plant's height increase the most? Give your answer in this format. (Eg Jan)
Image in this question is not available.
Level 1 PSLE
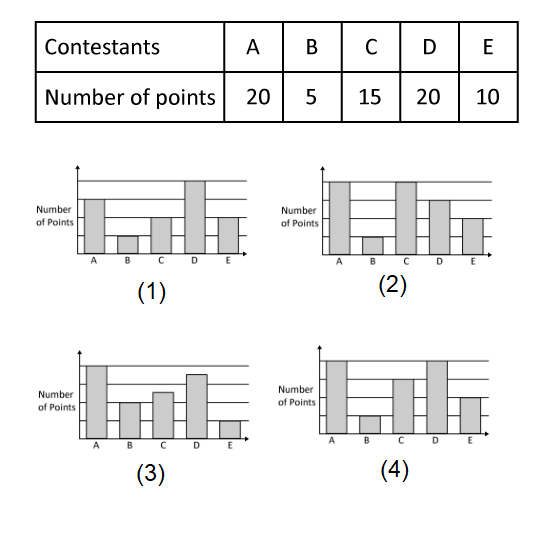
The table shows the points scored by 5 contestants in a game. Which of the following bar graphs represents the information shown in the table above?
Level 1 PSLE
The table shows the points scored by 5 contestants in a game. Which of the following bar graphs represents the information shown in the table above?
Image in this question is not available.
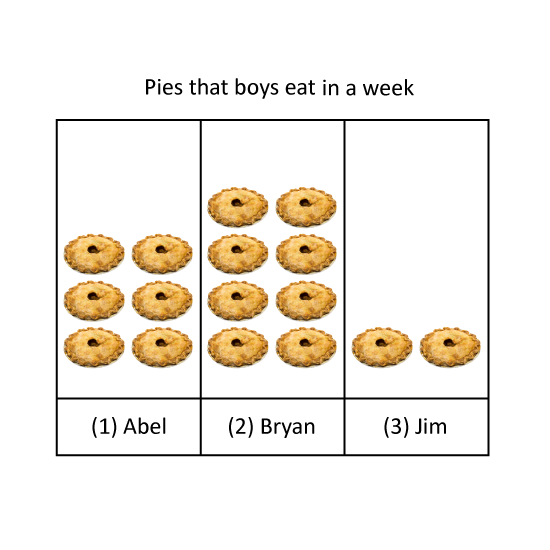
Level 2
Look at the picture graph.
The graph shows the number of pies 3 boys ate in a week.
Give the answers in numbers. (Eg 1)
- _____ ate the most number of pies.
- _____ ate the least number of pies.
- Jim ate _____ fewer pies than Bryan.
- The three boys ate _____ pies altogether.
Level 2
Look at the picture graph.
The graph shows the number of pies 3 boys ate in a week.
Give the answers in numbers. (Eg 1)
- _____ ate the most number of pies.
- _____ ate the least number of pies.
- Jim ate _____ fewer pies than Bryan.
- The three boys ate _____ pies altogether.
Image in this question is not available.
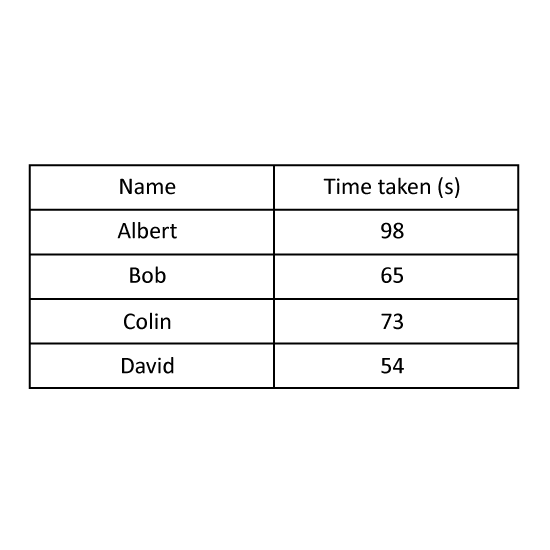
Level 2
Four boys took part in a race. The table shows the time taken by the four boys.
How much faster was the fastest runner in the race compared to Bob? Give your answer in seconds.
Level 2
Four boys took part in a race. The table shows the time taken by the four boys.
How much faster was the fastest runner in the race compared to Bob? Give your answer in seconds.
Image in this question is not available.
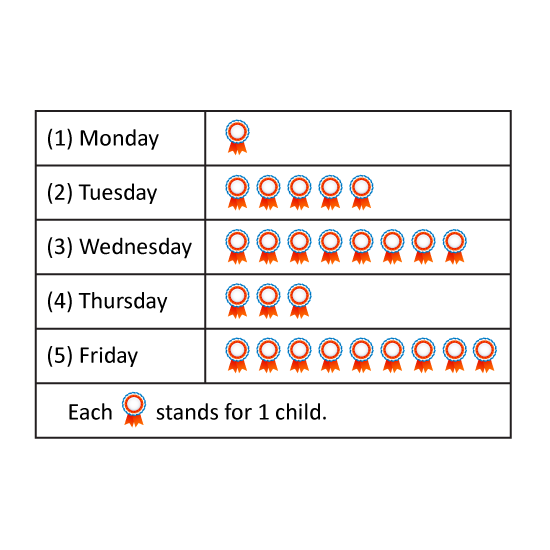
Level 2
Look at the picture graph.
This graph shows the favorite day of the week that children like.
- How many children like Tuesday?
- How many more children like Wednesday than Thursday?
- How many less children like Monday than Thursday?
- How many children like Friday and Tuesday?
Level 2
Look at the picture graph.
This graph shows the favorite day of the week that children like.
- How many children like Tuesday?
- How many more children like Wednesday than Thursday?
- How many less children like Monday than Thursday?
- How many children like Friday and Tuesday?
Image in this question is not available.
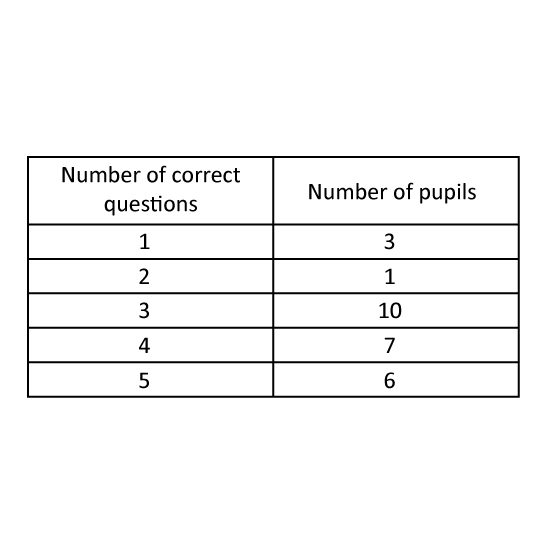
Level 2
The table shows the number of questions answered correctly by the pupils in a Science pop quiz. How many pupils answered 3 or more questions correctly?
Level 2
The table shows the number of questions answered correctly by the pupils in a Science pop quiz. How many pupils answered 3 or more questions correctly?
Image in this question is not available.