Level 1 PSLE
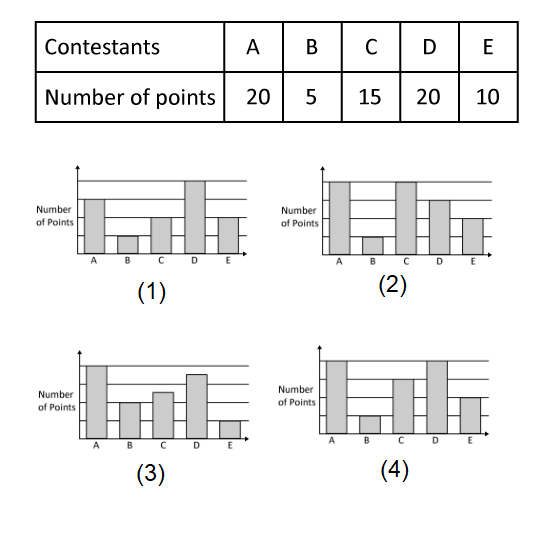
The table shows the points scored by 5 contestants in a game. Which of the following bar graphs represents the information shown in the table above?
Level 1 PSLE
The table shows the points scored by 5 contestants in a game. Which of the following bar graphs represents the information shown in the table above?
Image in this question is not available.
Level 2 PSLE
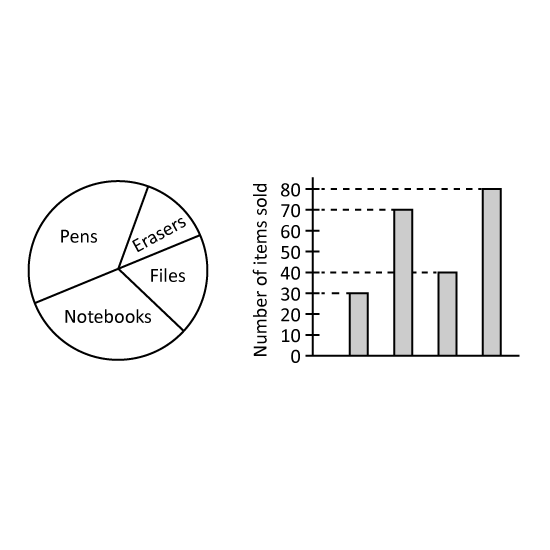
The pie chart shows the number of pens, erasers, file and notebook sold by a shop. The same information is shown in a bar graph, but the names of the items are not shown on the bar graph.
How many less erasers than pens are sold?
Level 2 PSLE
The pie chart shows the number of pens, erasers, file and notebook sold by a shop. The same information is shown in a bar graph, but the names of the items are not shown on the bar graph.
How many less erasers than pens are sold?
Image in this question is not available.
Level 2
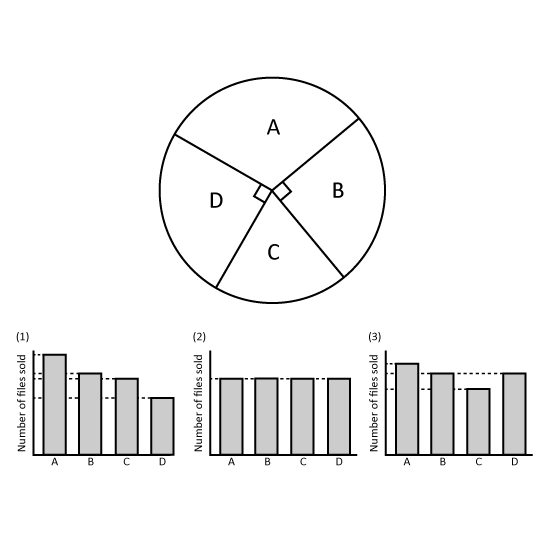
The pie chart shows the number of three types of files sold by a bookstore last week. Which bar graph best represents the information in the pie chart? Give your answer in number. (Eg 1)
Level 2
The pie chart shows the number of three types of files sold by a bookstore last week. Which bar graph best represents the information in the pie chart? Give your answer in number. (Eg 1)
Image in this question is not available.
Level 1 PSLE
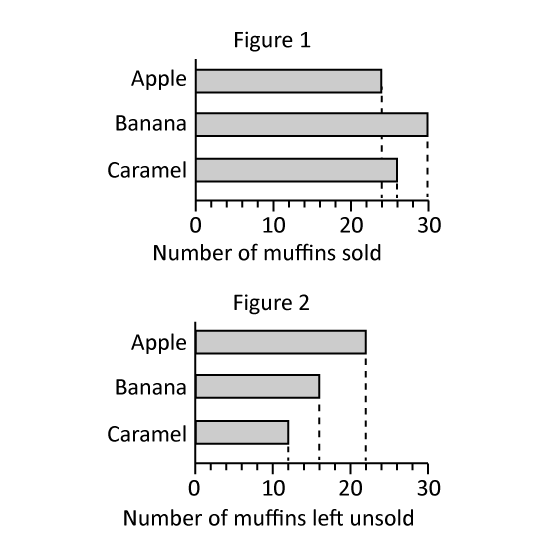
Jen baked some muffins to sell at a funfair. Figure 1 shows the number of muffins that was sold. Figure 2 shows the number of muffins left unsold at the end of the funfair.
- What was the number of caramel muffins Jen baked?
- Altogether, how many apples and banana muffins were left unsold after the funfair?
Level 1 PSLE
Jen baked some muffins to sell at a funfair. Figure 1 shows the number of muffins that was sold. Figure 2 shows the number of muffins left unsold at the end of the funfair.
- What was the number of caramel muffins Jen baked?
- Altogether, how many apples and banana muffins were left unsold after the funfair?
Image in this question is not available.
Level 1 PSLE
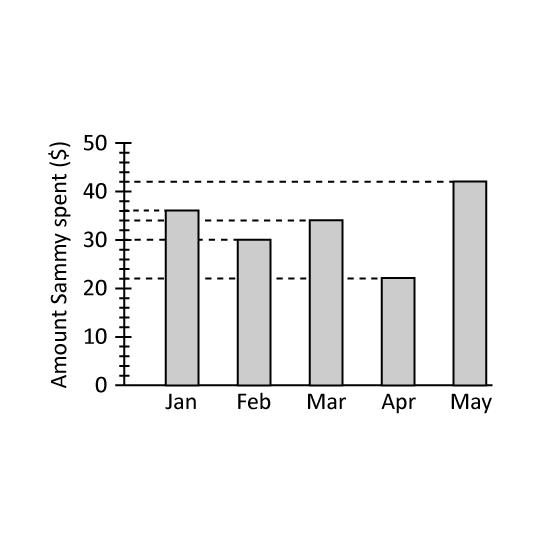
The bar graph shows the amount of pocket money Sammy spent each month from January to May.
- How much more money did Sammy spend in March than in April?
- Which months did Sammy spent more than $35? Give your answers in numbers in ascending order. (Eg Jan & Feb = 1, 2)
Level 1 PSLE
The bar graph shows the amount of pocket money Sammy spent each month from January to May.
- How much more money did Sammy spend in March than in April?
- Which months did Sammy spent more than $35? Give your answers in numbers in ascending order. (Eg Jan & Feb = 1, 2)
Image in this question is not available.
Level 1 PSLE
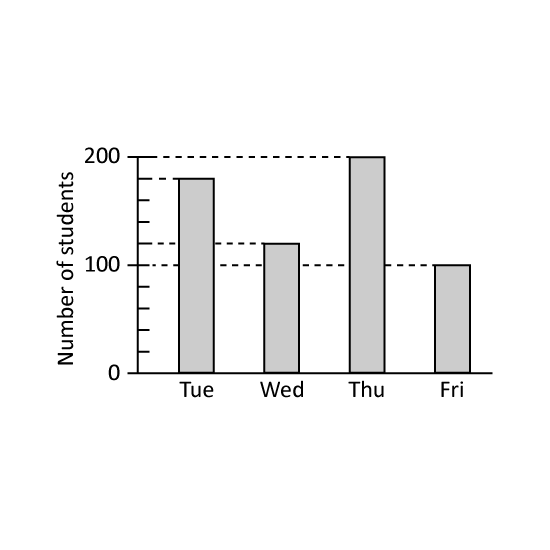
A school conducted checks on its Primary 6 students' eyesight from Tuesday to Friday. Each student had their eyes checked on one of the four days. The bar graph shows the number of students that were checked on each day. What percentage of the Primary 6 students had their eyes checked on Tuesday?
Level 1 PSLE
A school conducted checks on its Primary 6 students' eyesight from Tuesday to Friday. Each student had their eyes checked on one of the four days. The bar graph shows the number of students that were checked on each day. What percentage of the Primary 6 students had their eyes checked on Tuesday?
Image in this question is not available.
Level 1 PSLE
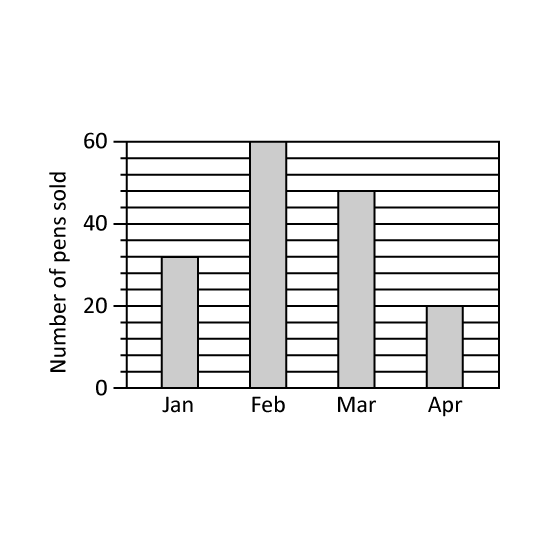
Look at the graph and answer the following questions.
- How many pens did the shop sell in March?
- The number of pens sold in May was an 60% increase from the number sold in April. How many pens were sold in May?
Level 1 PSLE
Look at the graph and answer the following questions.
- How many pens did the shop sell in March?
- The number of pens sold in May was an 60% increase from the number sold in April. How many pens were sold in May?
Image in this question is not available.
Level 2 PSLE
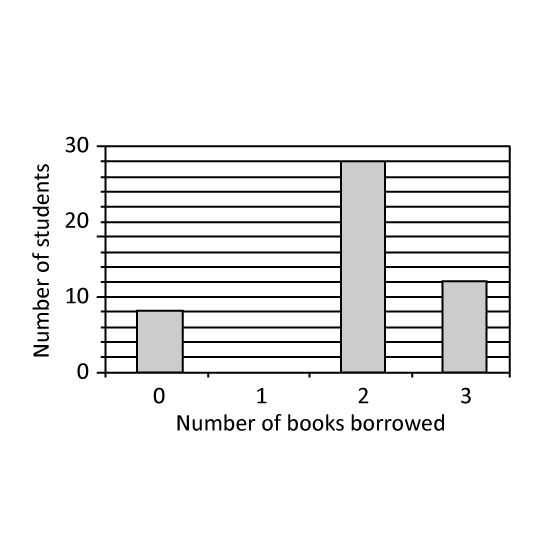
The bar graph shows the number of books borrowed by students in the school library. 14 of the students borrowed 1 book each. How many students borrowed 1 book each?
Level 2 PSLE
The bar graph shows the number of books borrowed by students in the school library. 14 of the students borrowed 1 book each. How many students borrowed 1 book each?
Image in this question is not available.
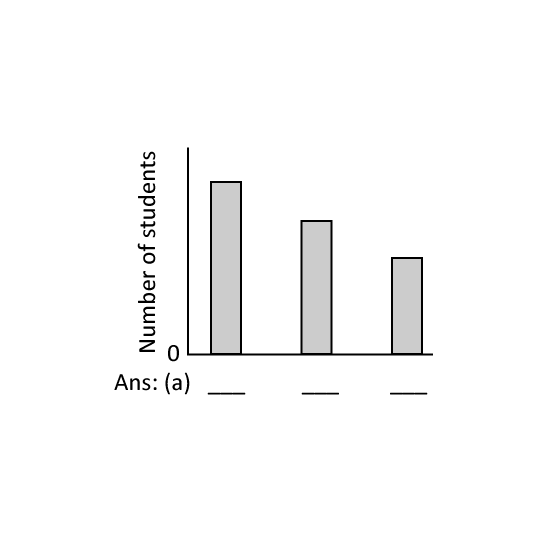
Level 2 PSLE Students played only one sport - basketball, football or volleyball.
13 of them played football. The number who played volleyball was
12 of the number who played basketball.
- Identify the sports of each bar. Give your answers in letters in the following sequence: Bar 1, Bar 2, Bar 3 by using the first letter of the sport. (Eg B, V, F for Basketball, Volleyball, Football)
- What fraction of the students played basketball?
Image in this question is not available.
Level 2 PSLE
School camp T-shirts were available in 4 colours: black, blue, red and white. At the camp, each child chose one T-shirt. The pie chart represents the children's choice of T-shirt colours. 40 children chose black T-shirts. The children's choice of T-shirt colours is also represented by the bar graph. The bar that shows the number of children who chose blue T-shirts has not been drawn. How many children chose blueT-shirts?
Image in this question is not available.