Level 1 PSLE
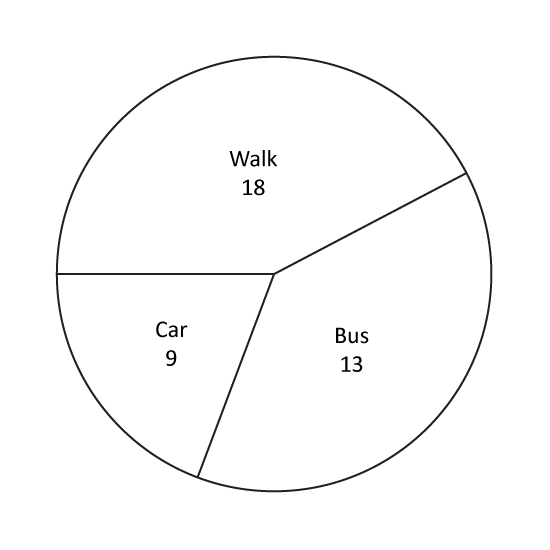
A group of 200 pupils was asked to name their favourite sports. The pie chart shows their choices and the number of pupils who chose each of the sports. Which sports was chosen by 25% of the pupils? Give the answer in letter.
Level 1 PSLE
A group of 200 pupils was asked to name their favourite sports. The pie chart shows their choices and the number of pupils who chose each of the sports. Which sports was chosen by 25% of the pupils? Give the answer in letter.
Level 2 PSLE A box contained black balls and green balls. 40% of the balls were green. After some red balls were added to the box, 28% of the balls were green. What percentage of the balls in the box were red?
Level 2 PSLE
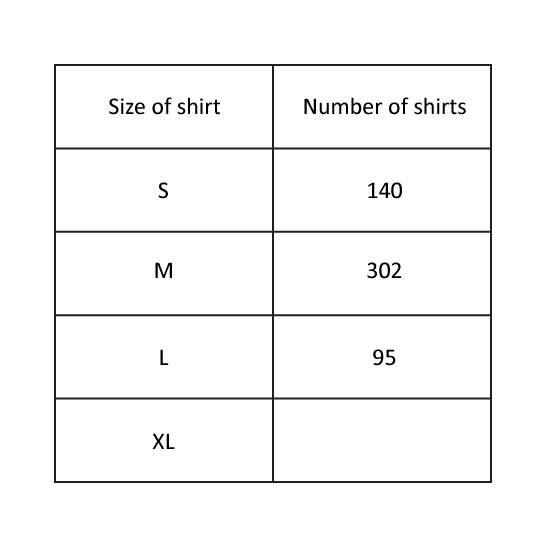
A shop sells shirts in four different sizes. The table shows the number of T-shirts sold in June for size S, M and L but not XL.
50% of the shirts sold were in size M. How many of the shirts sold were in size XL?
In July the number of shirts sold in size XL remained the same but there
was an increase in the number of shirts sold in the other sizes. Did the percentage of the shirts sold in size XL (1) increase, (2) decrease or (3) remain the same from June to July? Give the answer in number. (Eg 1)
Level 2 PSLE
A shop sells shirts in four different sizes. The table shows the number of T-shirts sold in June for size S, M and L but not XL.
50% of the shirts sold were in size M. How many of the shirts sold were in size XL?
In July the number of shirts sold in size XL remained the same but there
was an increase in the number of shirts sold in the other sizes. Did the percentage of the shirts sold in size XL (1) increase, (2) decrease or (3) remain the same from June to July? Give the answer in number. (Eg 1)
Level 2
At a stadium, there were 40 children from Club W and 10% more children from Club X. Some children from Club X left and the ratio of the number of children from Club W to the number of children from Club X became 5 : 2. How many children from Club X left?
Level 2 PSLE
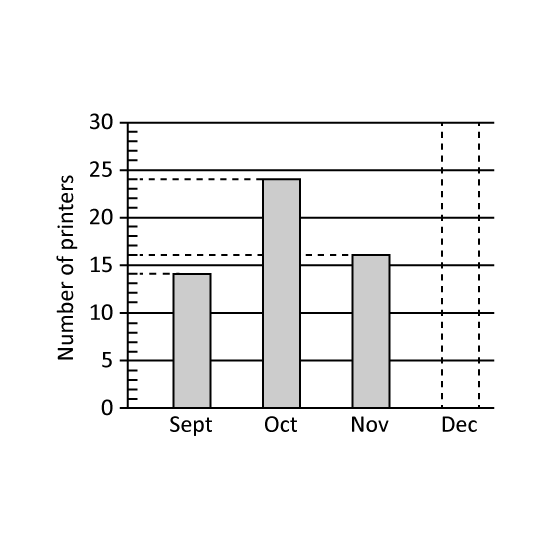
The bar graph shows the number of printers sold by Mr. Owen in 4 months. The bar that shows the number of printers sold in December has not been drawn. The number of printers sold in October was 30% of the total number of printers sold in the 4 months.
What was the total number of printers sold in the 4 months?
What was the number of printers sold in December?
Level 2 PSLE
The bar graph shows the number of printers sold by Mr. Owen in 4 months. The bar that shows the number of printers sold in December has not been drawn. The number of printers sold in October was 30% of the total number of printers sold in the 4 months.
What was the total number of printers sold in the 4 months?
Level 2 PSLE
A dancing club has 100 male and 50 female members. 10% of the male members and 40% of the female members are students. What percentage of the members are students?
Level 2 PSLE
A group of children was asked to choose one burger from chicken, beef, hotdog and mutton. The table represents the children's choices. The children's choices were also represented by a bar graph but the names of the burger were not shown. What was the total number of children who chose chicken and hotdog burgers?
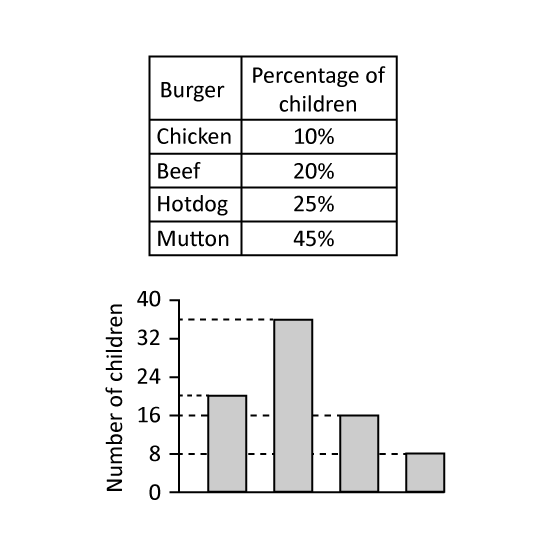
Level 2 PSLE
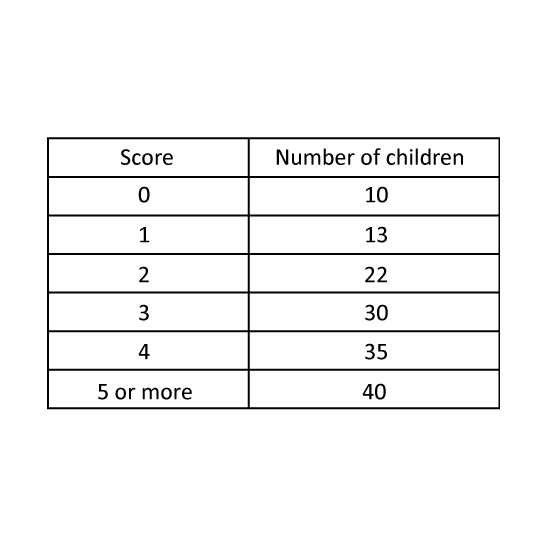
Participants of a quiz must obtain at least a certain score in the first round to qualify for the next round. There were 150 participants in the first round and the table shows the number of participants for each score. 50% of the participants did not qualify for the next round. From the table, what was the lowest score of a participant who qualified for the next round?
Level 2 PSLE
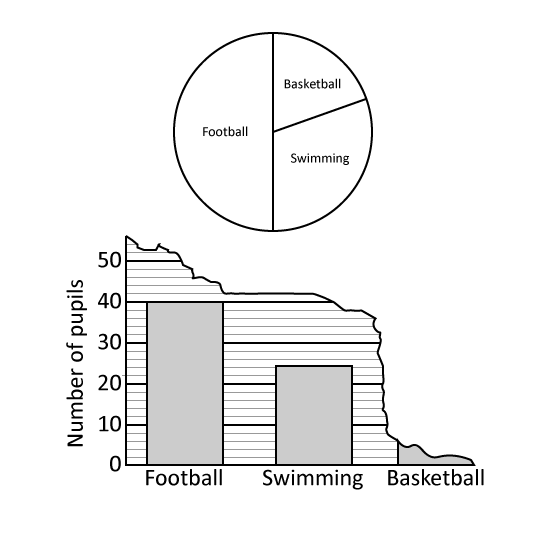
A group of boys were asked to choose their favourite sport from swimming, basketball and football. The pie chart represents the boys choices. Half of the group chose football.
What percentage of the group chose swimming?
The boys' choices were also represented by a bar graph. Part of the graph had been torn off. How many boys chose basketball?
Level 2 PSLE
A group of boys were asked to choose their favourite sport from swimming, basketball and football. The pie chart represents the boys choices. Half of the group chose football.
What percentage of the group chose swimming?
The boys' choices were also represented by a bar graph. Part of the graph had been torn off. How many boys chose basketball?
Level 2
Olivia and Fiona shared a box of chocolates. Olivia had 72% of the total chocolates. if Olivia gave 66 of her chocolates to Fiona, both would have the same number of chocolates. How many chocolates did Olivia have?
Level 1 PSLE
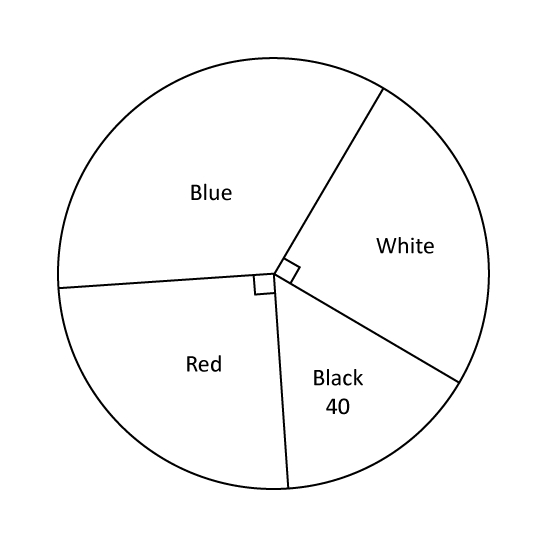
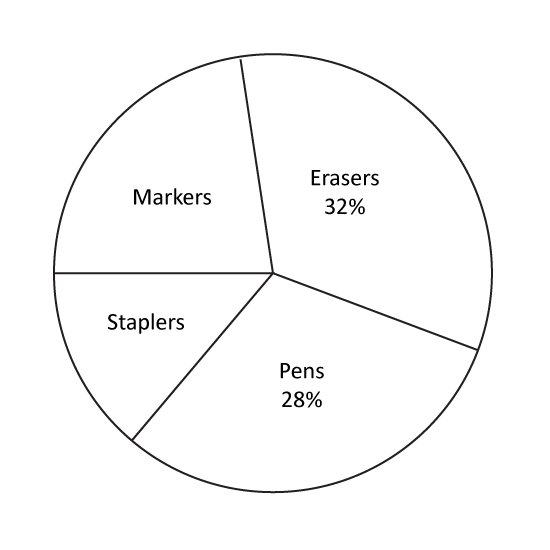
The pie chart represents the number of stationery sold by a shopkeeper. An equal number of markers and staplers were sold. What percentage of the stalks of flowers sold were markers?
Level 1 PSLE
The pie chart represents the number of stationery sold by a shopkeeper. An equal number of markers and staplers were sold. What percentage of the stalks of flowers sold were markers?
Level 3 PSLE
Bryan had a number of books for sale. He sold a total of 342 books on Saturday and Sunday. On Monday, he sold 14 of the remainder. He was left with 18% of the books he had at first. How many books did he have at first?
Level 2 PSLE
At a carnival, 65% of the tickets were sold at full price and 25% of the tickets at half price. The remaining 30 tickets were given away free. The total amount of money collected was $9300. What was the full price of a ticket?
Level 3 PSLE
Linda had a collection of stamps from South Africa, Finland and Jamaica. She had 124 stamps from South Africa. 30% of her stamps were from Finland. She had 12 fewer stamps from Jamaica than from Finland.
What was the total number of stamps in Linda's collection?
Linda's aunt gave her some stamps from Finland. Her total collection increased by 25%. What percentage of her collection was from Finland after that?
Level 3
Diana baked curry, sardine and chicken buns. She baked 60 curry buns. 20% of her buns were chicken. She baked 12 more sardine buns than chicken buns. How many curry buns and sardine buns did Diana bake altogether?
Level 3
Wendyville School had 1220 students and Janeville School had 30% more students. When an equal number of students left each school, the ratio of the students in Janeville School to that in Wendyville School became 2 : 1. How many students were there in both schools in the end?
Level 3 PSLE The number of boys and girls taking part in a quiz are in the ratio 4 : 7. These students are put into two groups. 60% of the boys and 30% of the girls are in Group 1. The rest of the students are in Group 2.
What is the ratio of the number of students in Group 2 to Group 1? Give your answer in the simplest form.
The number of boys in Group 2 is fewer than 50. What is the largest possible total number of students taking part in the quiz?
Level 3
Carl was fixing a jigsaw puzzle. By the second day, the number of pieces he fixed was 20% of the number of pieces unfixed. After another 8 days, he fixed another 196 pieces and the number of unfixed pieces he was left with was 20% of the number of pieces fixed. How many pieces were left unfixed?