The reports are available for Premium members only.
Why use limited features when you can enjoy full features and excel in Math?
There’s no risk. Cancel any time.
Let's start my subscription now.
5 per page
10 per page
20 per page
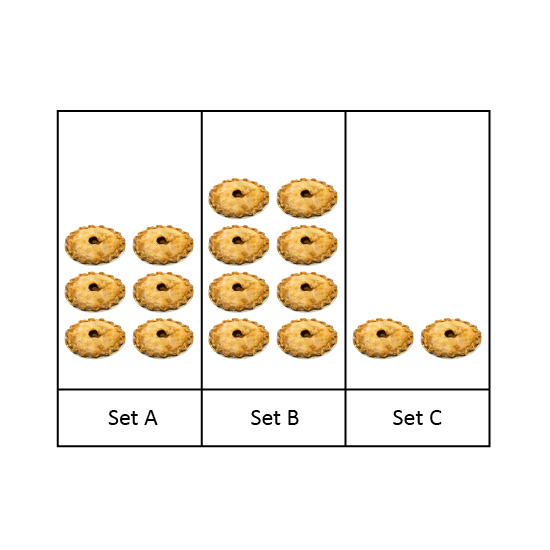
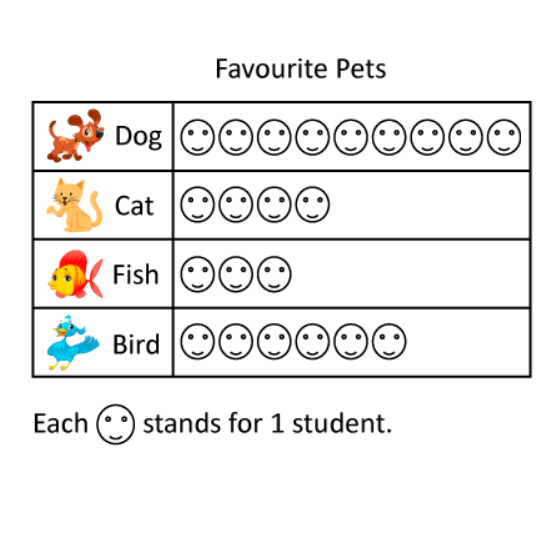
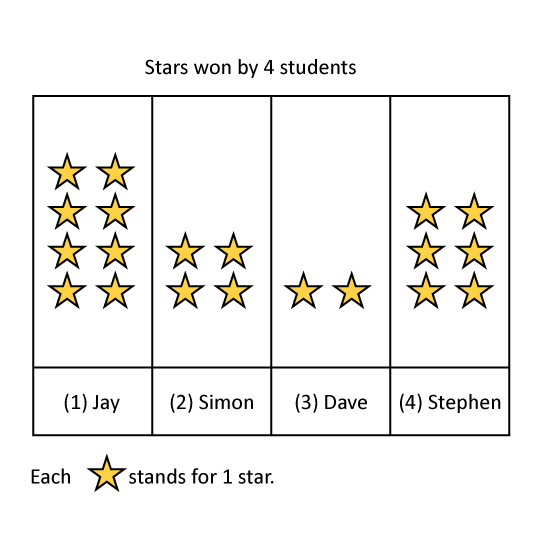
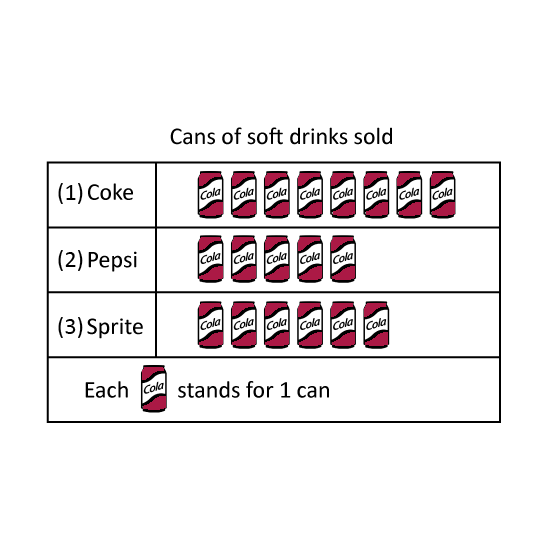
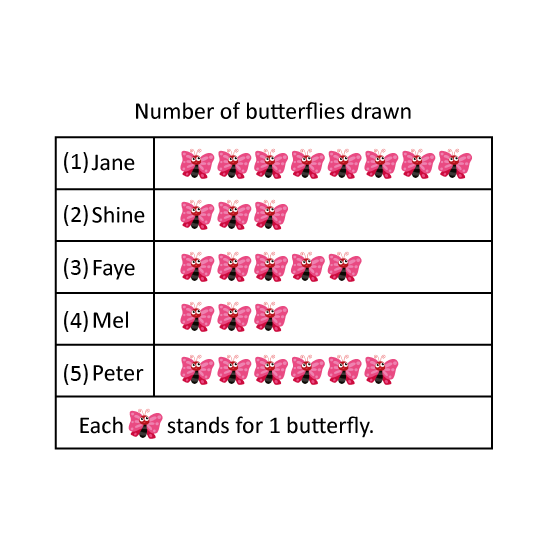
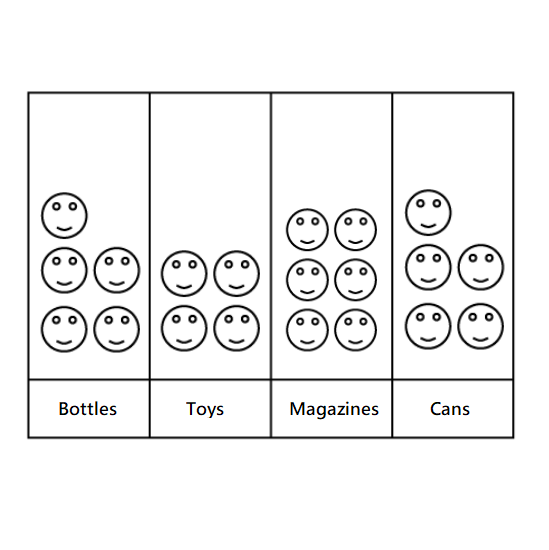
Question:
Practise Free Exam Papers with Analytics
Access our Infinite Question Clones with Analytics
Improve your speed with our Coin Speed Tracker
Get customised Speed Mastery Reports
Use our Cloud Notepad to practise and review
Master Shortcuts A* students know
I would like to receive updates of my child's progress and iSchool's newsletters.
By using this site, I agree to iSchool's Privacy Policy and Terms of Use.
Not a member yet? Sign up for free!
Child's Email
A password link has been sent to the Child's Email:
Please click the link to reset the Child's Password.
Please check your email and reset your password.
Email