Level 1 PSLE
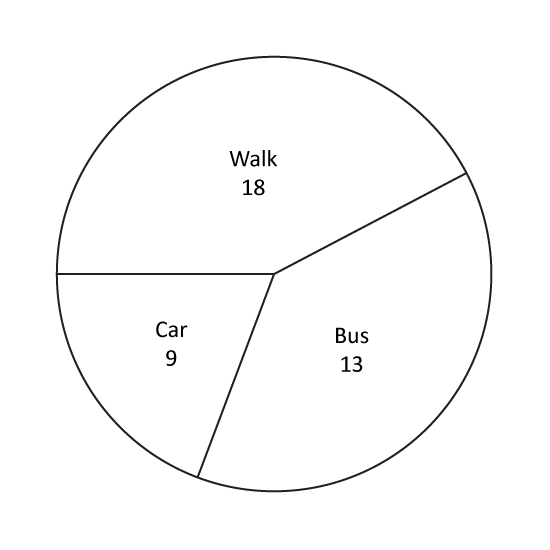
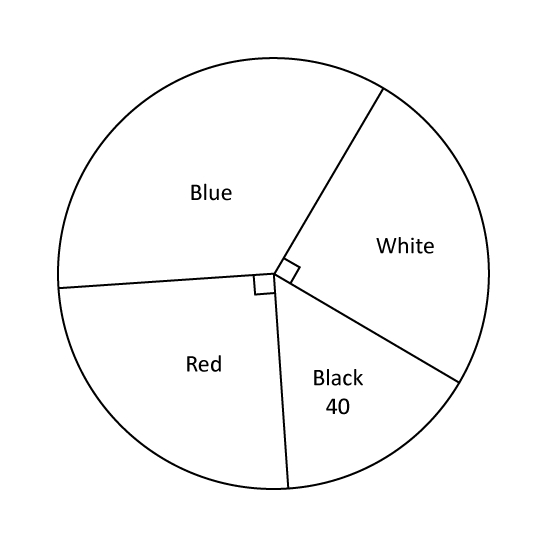
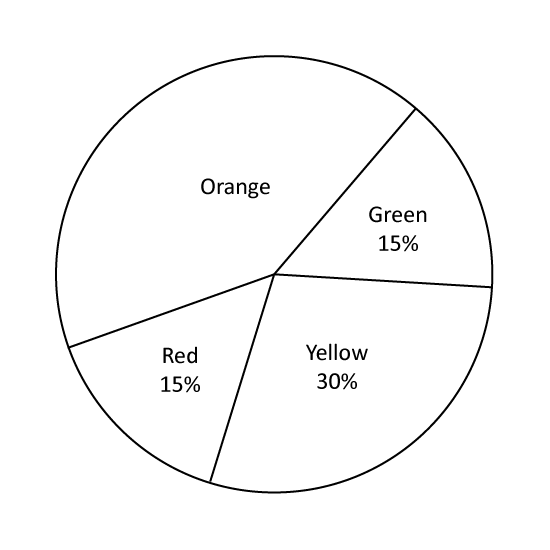
A group of 200 pupils was asked to name their favourite sports. The pie chart shows their choices and the number of pupils who chose each of the sports. Which sports was chosen by 25% of the pupils? Give the answer in letter.
Level 1 PSLE
A group of 200 pupils was asked to name their favourite sports. The pie chart shows their choices and the number of pupils who chose each of the sports. Which sports was chosen by 25% of the pupils? Give the answer in letter.
Level 1 PSLE
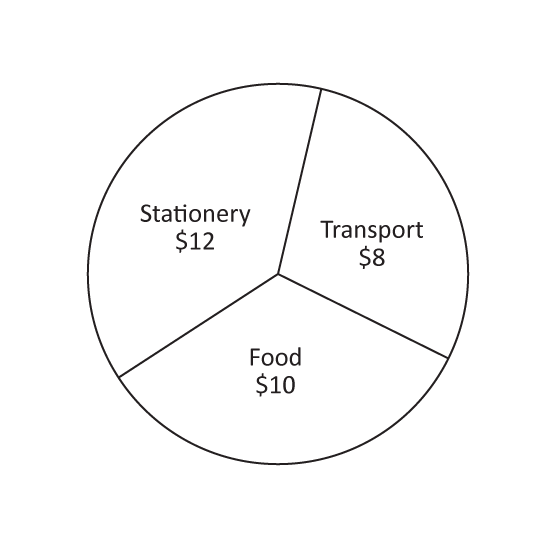
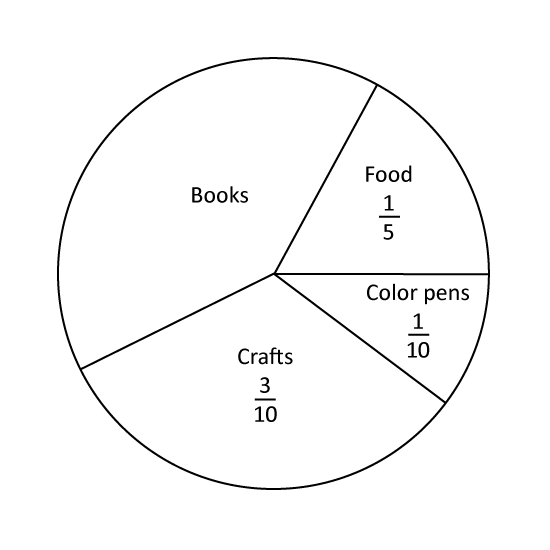
The pie chart shows how Jenny spent her pocket money last month. What is the ratio of the amount of money Jenny spent on crafts to the amount she spent on books?
Level 1 PSLE
The pie chart shows how Jenny spent her pocket money last month. What is the ratio of the amount of money Jenny spent on crafts to the amount she spent on books?