Level 1
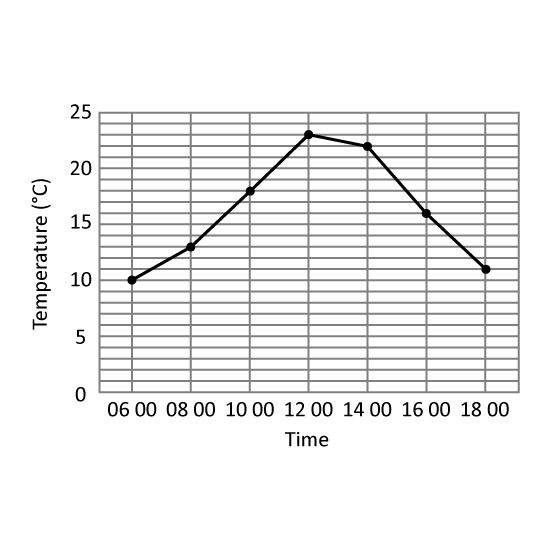
The table shows the temperature change in Hillview Town.
At which 2 hour-interval of the day was there the greatest change in temperature? Give your answer in this format. (Eg 1200 to 1400)
Level 1
The table shows the temperature change in Hillview Town.
At which 2 hour-interval of the day was there the greatest change in temperature? Give your answer in this format. (Eg 1200 to 1400)
Level 1
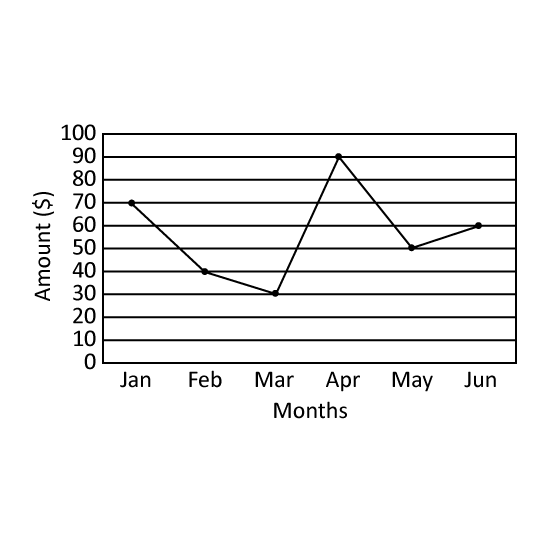
The line graph shows the amount of utility bills paid by Mr Gann's household in the first six months of the year. In which month did the greatest decrease in utility bills occur? Give the answer in short form. (Eg Jan)
Level 1
The line graph shows the amount of utility bills paid by Mr Gann's household in the first six months of the year. In which month did the greatest decrease in utility bills occur? Give the answer in short form. (Eg Jan)
Level 1
Jamila took 1 hour 25 minutes to travel from school to his house. If he arrived home at 3.30 p.m., what time did he leave the school? (Give your answer in 12-hour clock format.)
Level 1
Collin took 15 min to drive from his house to the warehouse and 3 h 50 min to deliver goods from the warehouse to various places. He finished delivering the goods at 18 20. At what time did Collin leave his house? (Give your answer in 24-hour clock format.)
Level 2
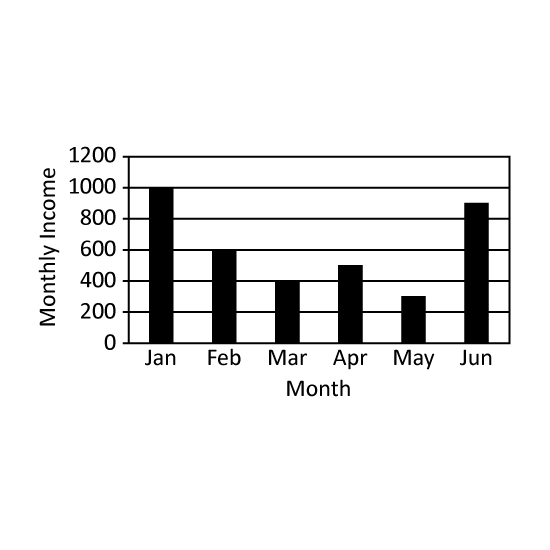
The graph shows the monthly income of Mr Chai for the first half of the year. In which month was his income 35 of her combined income in January and April? Give the answer in short form. (Eg Jan)
Level 2
The graph shows the monthly income of Mr Chai for the first half of the year. In which month was his income 35 of her combined income in January and April? Give the answer in short form. (Eg Jan)
Level 2
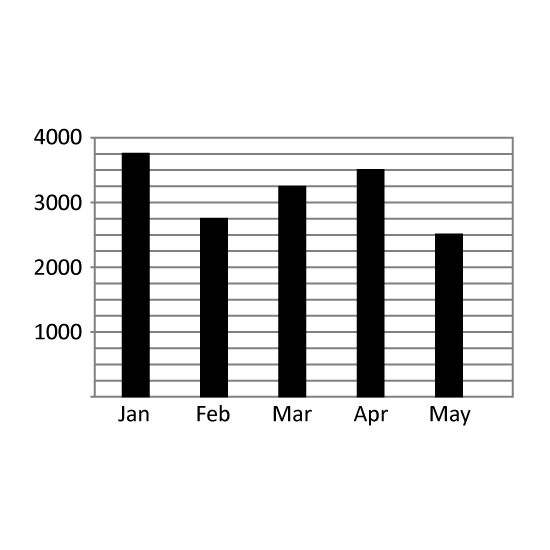
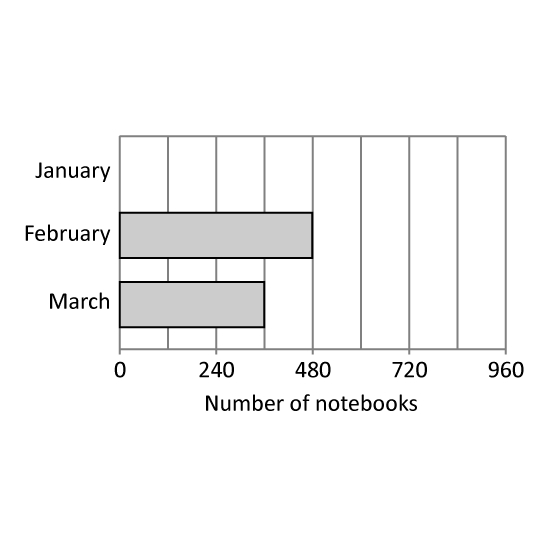
The bar graph shows the number of notebooks sold in 3 months. The bar that shows the number of notebooks in January is not drawn. 38 of the total number of notebooks sold in the 3 months were sold in January. How many notebooks were sold in January?
Level 2
The bar graph shows the number of notebooks sold in 3 months. The bar that shows the number of notebooks in January is not drawn. 38 of the total number of notebooks sold in the 3 months were sold in January. How many notebooks were sold in January?