Level 1
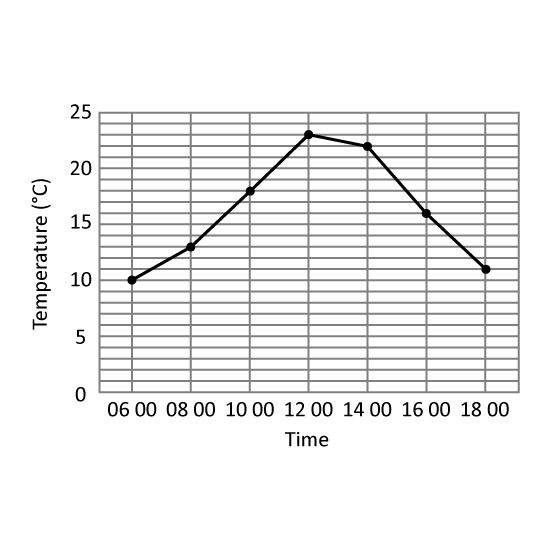
The table shows the temperature change in Hillview Town.
At which 2 hour-interval of the day was there the greatest change in temperature? Give your answer in this format. (Eg 1200 to 1400)
Level 1
The table shows the temperature change in Hillview Town.
At which 2 hour-interval of the day was there the greatest change in temperature? Give your answer in this format. (Eg 1200 to 1400)
Level 1 PSLE
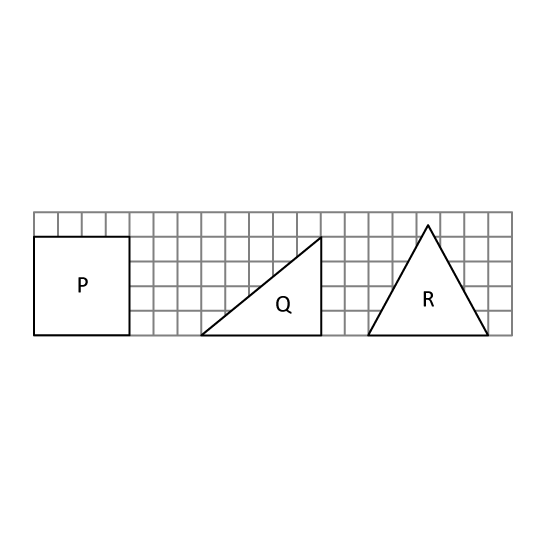
In the square grid, P is a square, Q is a right-angled triangle and R is an equilateral triangle. Arrange P, Q and R from the smallest area to the largest.
Level 1 PSLE
In the square grid, P is a square, Q is a right-angled triangle and R is an equilateral triangle. Arrange P, Q and R from the smallest area to the largest.
Level 1
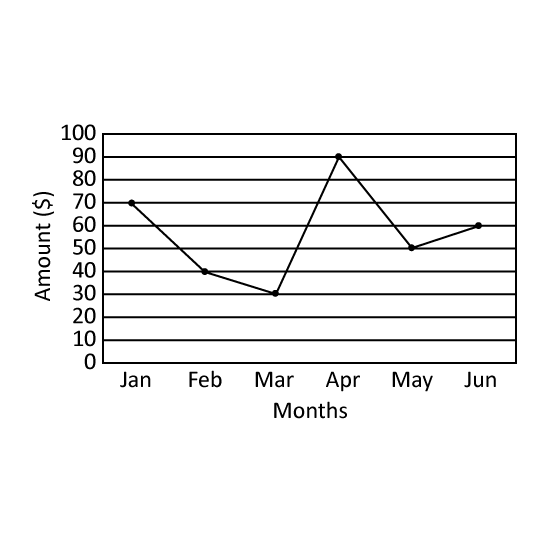
The line graph shows the amount of utility bills paid by Mr Gann's household in the first six months of the year. In which month did the greatest decrease in utility bills occur? Give the answer in short form. (Eg Jan)
Level 1
The line graph shows the amount of utility bills paid by Mr Gann's household in the first six months of the year. In which month did the greatest decrease in utility bills occur? Give the answer in short form. (Eg Jan)