Level 2
Fanny started brisk walking at 09 00. Jade started brisk walking 16 min later but stopped brisk walking 4 min earlier than Fanny. Fanny stopped brisk walking at 11 05. How long did Jade brisk walk? Give your answer in this format. (Eg 1 h 20 min)
Level 2
Jenny's colour printer takes 14 minute to print one large photograph. Jenny set the colour printer to print 32 such large photographs continuously. What is the latest time Jenny must start printing so that the photographs are printed by 2.05 p.m.?
Level 2
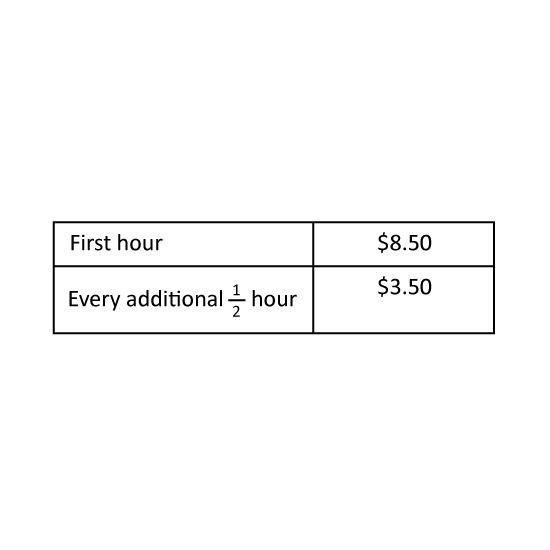
The table shows how much a shop charges a customer for renting a pair of rollerblades.
Ms Chan paid $26 for renting a pair of rollerblades starting from 09 00. What would be the latest time she must return the pair of rollerblades to the shop?
Level 2
The table shows how much a shop charges a customer for renting a pair of rollerblades.
Ms Chan paid $26 for renting a pair of rollerblades starting from 09 00. What would be the latest time she must return the pair of rollerblades to the shop?
Level 2
A clock was set correctly at 12 25. It gains exactly 10 min with each passing hour. It shows 19 25 now on the clock. What should the correct time be now?
Level 2
From January to August last year, Sherrie read an average number of 7.5 story books per month. She did not read any story books in the next 4 months. On the average, how many story books did she read per month last year?
Level 2
Jun took 1 h 45 min to paint a cabinet and 55 min less to paint a door. He completed painting the cabinet and door at 3:15 p.m. At what time did he start painting?
Level 3
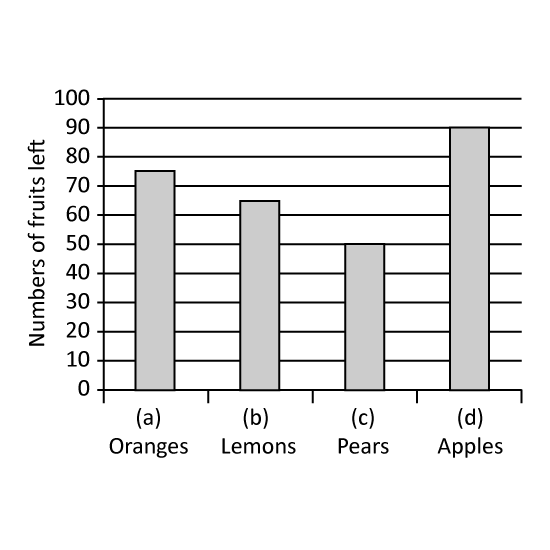
A fruit seller displayed the same amount of each type of fruits for sale every morning from Monday to Saturday in a week. She charted each type of fruits which were left unsold at the end of the week as shown in the graph.
Which type of fruit was the most popular?
If she had 720 fruits in the beginning of the week, how many fruits did she sell in the week?
Level 3
A fruit seller displayed the same amount of each type of fruits for sale every morning from Monday to Saturday in a week. She charted each type of fruits which were left unsold at the end of the week as shown in the graph.
Which type of fruit was the most popular?
If she had 720 fruits in the beginning of the week, how many fruits did she sell in the week?
Level 1
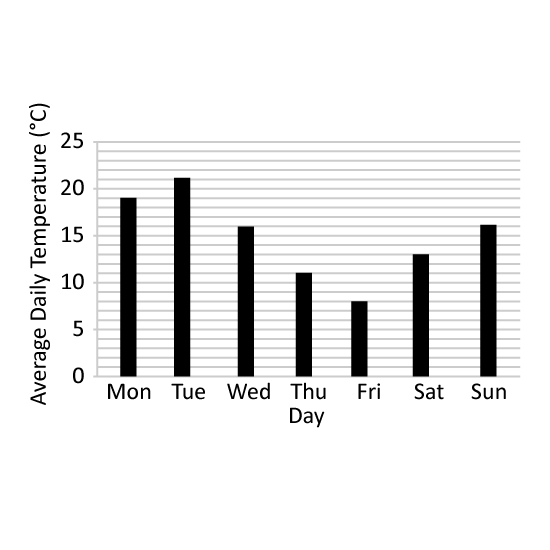
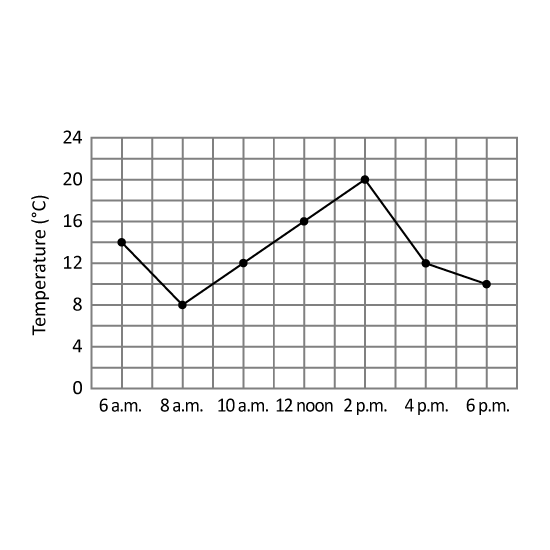
The bar graph shows the average daily temperature experienced by Country A in a week. What was the difference in the highest and lowest average daily temperatures in that week?
Level 1
The bar graph shows the average daily temperature experienced by Country A in a week. What was the difference in the highest and lowest average daily temperatures in that week?
Level 3
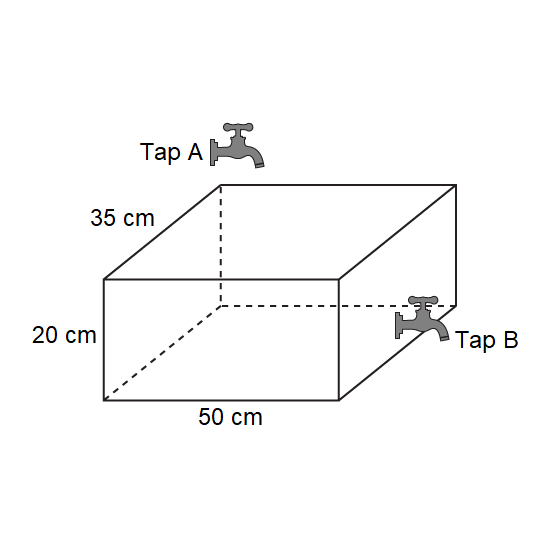
An empty tank measures 50 cm by 20 cm by 35 cm. Water flows into the tank from Tap A at a rate of 25 ℓ per minute. At the same time, water drains from the tank from Tap B at a rate of 18 ℓ per minute. How long would it take to completely fill the tank?
Level 3
An empty tank measures 50 cm by 20 cm by 35 cm. Water flows into the tank from Tap A at a rate of 25 ℓ per minute. At the same time, water drains from the tank from Tap B at a rate of 18 ℓ per minute. How long would it take to completely fill the tank?