Level 2
Adam has 200 red stickers, blue stickers and green stickers.
40% of the stickers are blue.
There are 10 more red stickers than green stickers.
  1. How many green stickers are there?
  2. How many less red stickers than blue stickers?
2 m
Level 3
The ratio of saloon cars to the total number of cars on display in Ken's car shop was 2 : 7. 25 of the remaining bikes on display were family cars and the rest were electric cars and sports cars in the ratio of 10 : 3. If there were 16 more electric cars than saloon cars, how many sports cars were there?
4 m
Level 3
Adam has 200 red stickers, blue stickers, yellow stickers and green stickers.
20% of the stickers are red.
40% of the stickers are blue.
The rest are yellow and green stickers.
There are 10 more yellow stickers than green stickers.
  1. How many green stickers are there?
  2. How many less red stickers than blue stickers?
2 m
Level 2
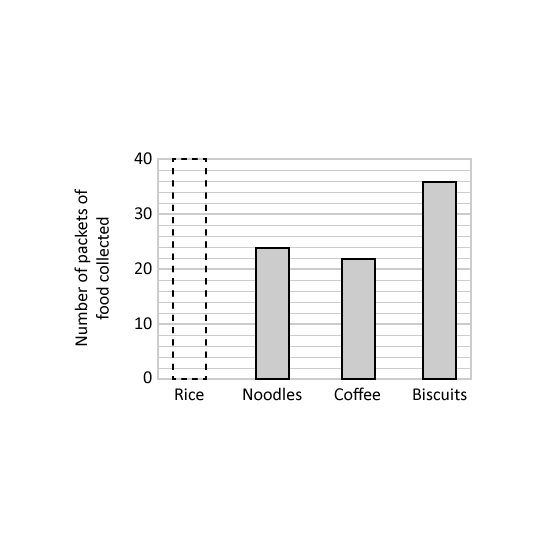
The bar graph shows the number of packets of different food collected in a donation drive.
  1. 15 of the total number of packets of food collected was coffee. How many packets of rice were collected?
  2. The table shows the mass of each packet of food. What is the difference between the total mass of noodles collected and the total mass of biscuits collected? Give your answer in kg.
3 m
Level 3
At a school sports festival, 13 of the participants were P5 and P6 students. 25 of the remaining participants were P3 and P4 students. The rest were P1 and P2 students in the ratio of 3 : 7 respectively. There were 208 fewer P1 students than the total number of P5 and P6 students. How many students were there at the school sports festival?
4 m
Level 2
During a sale, Kimberly bought a skirt and a coat at a discount. She paid a total of $141.10 on these two items. She paid $20.50 more on the skirt than on the coat.
  1. How much did she pay for the skirt?
  2. Kimberly received a total discount of $33.20 for the skirt and the coat. What is the percentage discount given by the shop? Give your answer correct to 1 decimal place.
3 m
Level 3
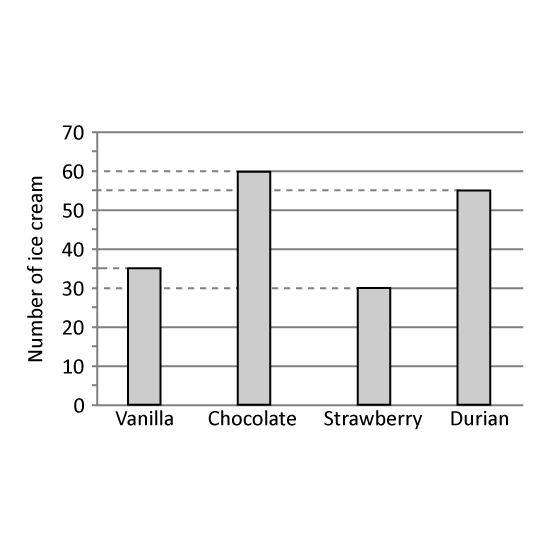
The bar graph shows the number of ice-cream flavours sold at a shop in a day.
  1. What percentage of the ice-creams sold was durian ice-creams? Give your answer correct to 1 decimal place.
  2. The cost of each ice-cream was the same. The amount of money collected for vanilla ice-creams was $15 more than the amount of money collected for strawberry ice-creams. What was the total amount of money collected from the sale of all the ice-creams?
3 m
Level 2
Fill in the blanks.
The number of red stickers is 120% the number of blue stickers.
  1. Number of red stickers = _____ u
  2. Number of blue stickers = _____ u
  3. Total number of stickers = _____ u
  4. Number of more red stickers than blue stickers = _____ u
4 m
Level 2
Fill in the blanks . Adam has 60% more red stickers than blue stickers.
  1. Number of red stickers = _____ u
  2. Number of blue stickers = _____ u
  3. Total number of stickers = _____ u
  4. Number of more red stickers than blue stickers = _____ u
4 m
Level 3
A box contained red, blue and purple markers. 25 of the markers were red and 29 of the remainder were blue markers. The rest were purple markers.
  1. Find the ratio of the number of purple markers to the number of red markers.
  2. There were 160 fewer blue markers than red markers. How many markers were there in the box?
4 m