Level 3
Ben drove a car at an average speed of 84 km/h for 45 minutes. He then reduced his average speed by 6 km/h and drove another 30 min before he reached his destination. Find the total distance covered by Ben.
Level 3
A coach driver drove the first 4 h of a journey at an average speed 64 km/h. Driving at an average speed of 90 km/h, he then took another 5 h to complete his remaining journey. Find his average speed for the whole journey. Give the answer in mixed number.
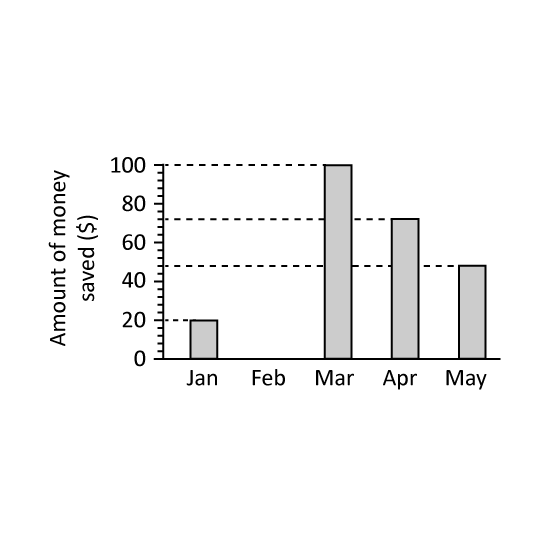
Level 2 The graph shows the amount of money Ron saved from his pocket money every month from January to May.
How much money did Ron save altogether from January to May?
What was the average amount of money Ron saved from January to May?
Ron saved $80 in June. The amount saved increased by 100% from June to July and another 100% from July to August. How much money did Ron save in August?
Level 3
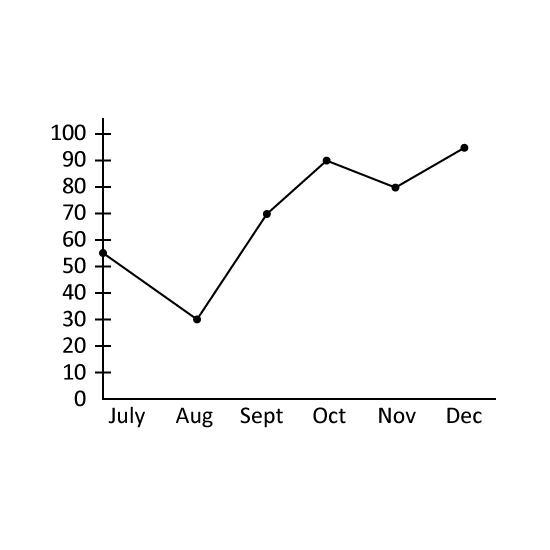
The line graph shows the number of dresses sold by a shop from July to December in 2013.
What was the average number of dresses sold per month from July to December in 2013?
The total number of dresses sold for the same period from July to December in 2012 was 672. Find the percentage decrease in the total number of dresses sold for the same period from 2012 to 2013.
Level 3
The line graph shows the number of dresses sold by a shop from July to December in 2013.
What was the average number of dresses sold per month from July to December in 2013?
The total number of dresses sold for the same period from July to December in 2012 was 672. Find the percentage decrease in the total number of dresses sold for the same period from 2012 to 2013.