Level 2 PSLE
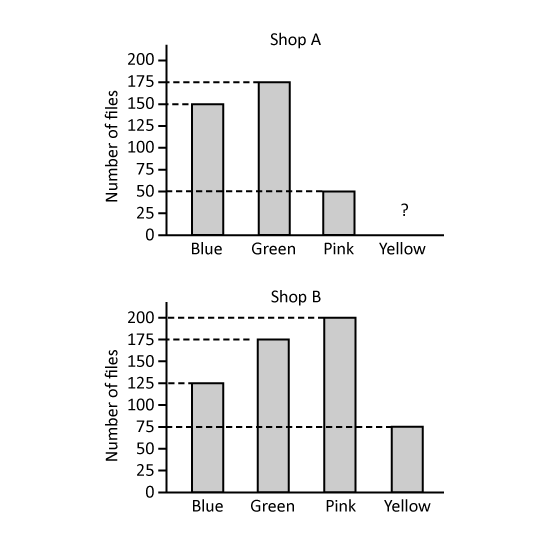
Shops A and B sell highlighters of four colours. The bar graphs show the number of highlighters sold by each shop in April.
The bar for the number yellow highlighters sold by Shop A has not been drawn.
Half of the highlighters sold by Shop A were yellow highlighters. How many yellow highlighters did Shop A sell?
Which colour(s) of highlighters did Shop A sell less than Shop B? (Give your answer(s) in letter(s) in alphabetical order. Eg Blue, Red = B, R
In May, Shop B sold 75 more blue highlighters than the number of blue highlighters sold in April. What was the percentage increase in the number of blue highlighters sold by Shop B from April to May?
Level 2 PSLE
Shops A and B sell highlighters of four colours. The bar graphs show the number of highlighters sold by each shop in April.
The bar for the number yellow highlighters sold by Shop A has not been drawn.
Half of the highlighters sold by Shop A were yellow highlighters. How many yellow highlighters did Shop A sell?
Which colour(s) of highlighters did Shop A sell less than Shop B? (Give your answer(s) in letter(s) in alphabetical order. Eg Blue, Red = B, R
In May, Shop B sold 75 more blue highlighters than the number of blue highlighters sold in April. What was the percentage increase in the number of blue highlighters sold by Shop B from April to May?