Level 3
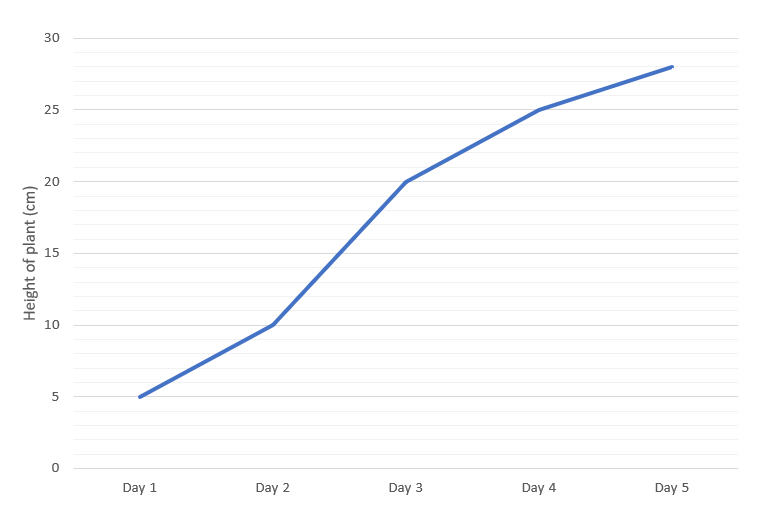
Marissa bought a plant that was 5 cm tall. Every morning, she measured the height of the plant and recorded its height for the day. The line graph shows her records.
What was the height of the plant when it was measured on Day 3?
Between which two days was the increase in the height of the plant the greatest? Give the answer in numbers. (Eg 1, 2)
In Day 6, the height of the plant dropped to 35 of Day 4. What is the height of the plant on Day 6?
Level 3
Marissa bought a plant that was 5 cm tall. Every morning, she measured the height of the plant and recorded its height for the day. The line graph shows her records.
What was the height of the plant when it was measured on Day 3?
Between which two days was the increase in the height of the plant the greatest? Give the answer in numbers. (Eg 1, 2)
In Day 6, the height of the plant dropped to 35 of Day 4. What is the height of the plant on Day 6?
Level 3 PSLE The number of boys and girls taking part in a quiz are in the ratio 4 : 7. These students are put into two groups. 60% of the boys and 30% of the girls are in Group 1. The rest of the students are in Group 2.
What is the ratio of the number of students in Group 2 to Group 1? Give your answer in the simplest form.
The number of boys in Group 2 is fewer than 50. What is the largest possible total number of students taking part in the quiz?
Level 2
There are between 100 and 120 lollipops in a jar. The lollipops can be shared equally among 7 or 8 children. How many lollipops are there in the jar?