Level 2
Jun took 1 h 45 min to paint a cabinet and 55 min less to paint a door. He completed painting the cabinet and door at 3:15 p.m. At what time did he start painting?
Level 3
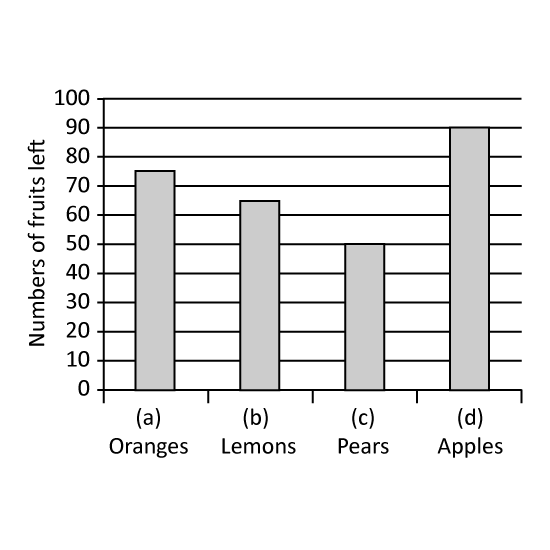
A fruit seller displayed the same amount of each type of fruits for sale every morning from Monday to Saturday in a week. She charted each type of fruits which were left unsold at the end of the week as shown in the graph.
Which type of fruit was the most popular?
If she had 720 fruits in the beginning of the week, how many fruits did she sell in the week?
Level 3
A fruit seller displayed the same amount of each type of fruits for sale every morning from Monday to Saturday in a week. She charted each type of fruits which were left unsold at the end of the week as shown in the graph.
Which type of fruit was the most popular?
If she had 720 fruits in the beginning of the week, how many fruits did she sell in the week?
Level 1
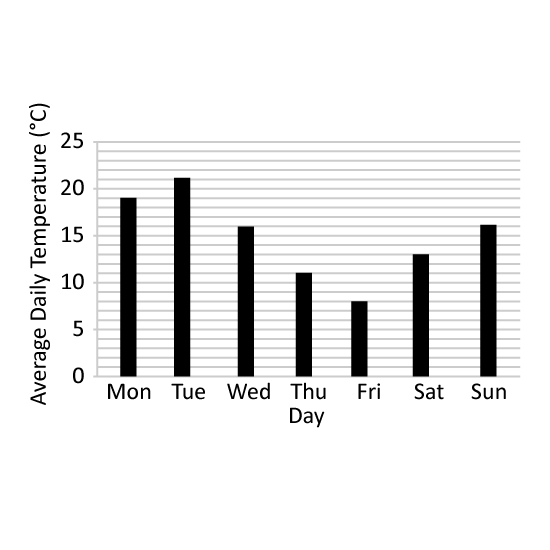
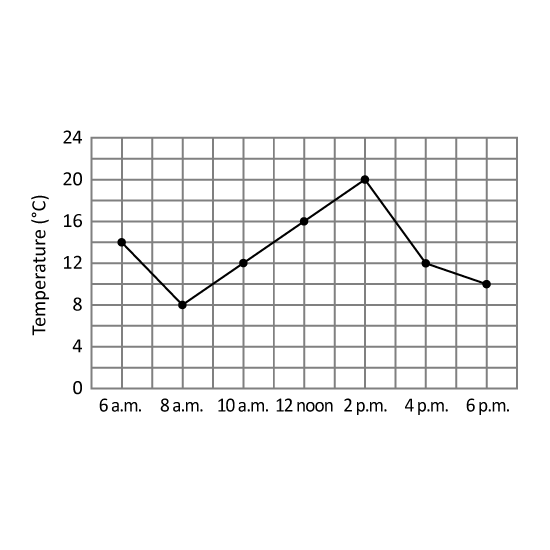
The bar graph shows the average daily temperature experienced by Country A in a week. What was the difference in the highest and lowest average daily temperatures in that week?
Level 1
The bar graph shows the average daily temperature experienced by Country A in a week. What was the difference in the highest and lowest average daily temperatures in that week?
Level 3
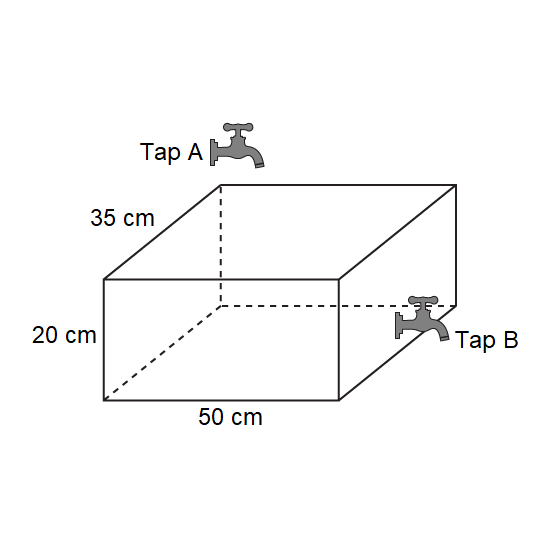
An empty tank measures 50 cm by 20 cm by 35 cm. Water flows into the tank from Tap A at a rate of 25 ℓ per minute. At the same time, water drains from the tank from Tap B at a rate of 18 ℓ per minute. How long would it take to completely fill the tank?
Level 3
An empty tank measures 50 cm by 20 cm by 35 cm. Water flows into the tank from Tap A at a rate of 25 ℓ per minute. At the same time, water drains from the tank from Tap B at a rate of 18 ℓ per minute. How long would it take to completely fill the tank?