Level 3
Adam has some blue stickers and red stickers.
The number of blue stickers is decreased by 20% to 160.
The number of red stickers is decreased by 30% to 70.
Level 3
Adam has some blue stickers and red stickers.
The number of blue stickers is increased by 20% to 60.
The number of red stickers is decreased by 30% to 70.
Level 2
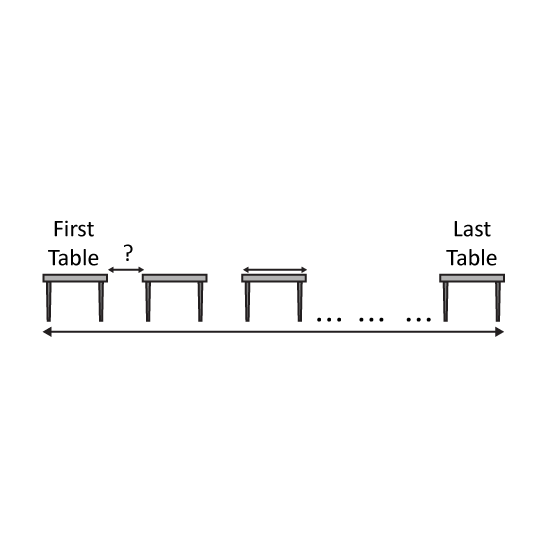
6 similar tables with a length of 50 cm each, are placed from one end to the other end of a corridor at an equal distance apart, as shown in the figure. The total length of the walkway is 900 cm. What is the spacing between each table?
Level 2
6 similar tables with a length of 50 cm each, are placed from one end to the other end of a corridor at an equal distance apart, as shown in the figure. The total length of the walkway is 900 cm. What is the spacing between each table?
Level 2
Three bottles, S, T and U, contain a total of 13.5 ℓ of water. Bottle S contains 1.3 ℓ of water more than Bottle T. Bottle T contains 4.3 ℓ of water more than Bottle U. What is the volume of water in Bottle T?
Level 3 PSLE
Blake and Steve ran in a race. When Steve had completed the race, Blake had only run 58 of the distance. Steve's speed was 75 m/min faster than Blake's speed. Both of them did not change their speeds throughout the race. What was Blake's speed in m/min?
Level 3
The line graph shows the number of boys and girls in each sports school.
How many pupils were there in Sports School B?
How many more girls than boys were there in Sports School C?
At the end of the year, an equal number of boys and girls from Sports School D were transferred to Sports School A. The fraction of the number of boys to girls in Sports School A becomes 23. Find the total number of boys and girls that were transferred from Sports School D to Sports School A.
Level 3
Joe took 12 min to cycle from his home to a park for his morning exercise. After the exercise, he took 60 min to walk the same route home. The difference between his cycling and walking speed was 40 km/h. How far was Joe's home from the park?
Level 3
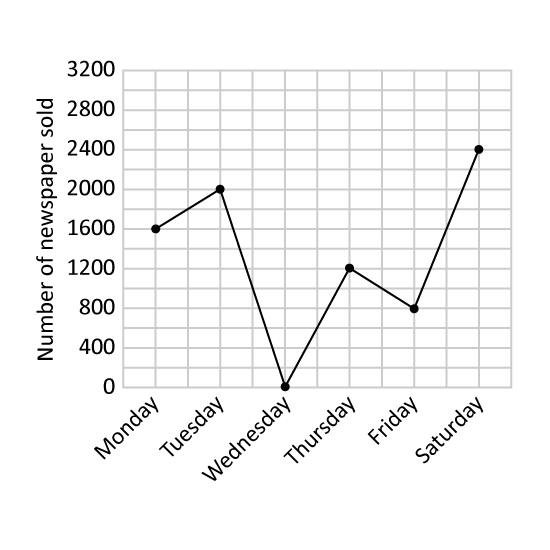
The line graph shows the total number of cars sold by a car dealer in the first six months of the year.
In which two months were there a consecutive increase in the number of cars sold? Give the answer in short form. (Eg Jan, Feb)
What fraction of the cars was sold in the month of the lowest sale?
The car dealer was paid a fixed amount of money for every car he sold. He received $3200 more in April than in February. How much money did he receive from selling a car?
Level 3
Adam ran around a rectangular field from W to X to Y to Z and back to W. He covered a distance of 300 m. If the length of the field is twice the breadth, what is the area of the field?
Level 3
King took 6 hours to drive from Point A to Point B while Jack took 4 hours to drive from Point B to Point A. When they met each other, they were 48 km away from the midpoint of Point A and Point B. What was King's speed?