Level 2
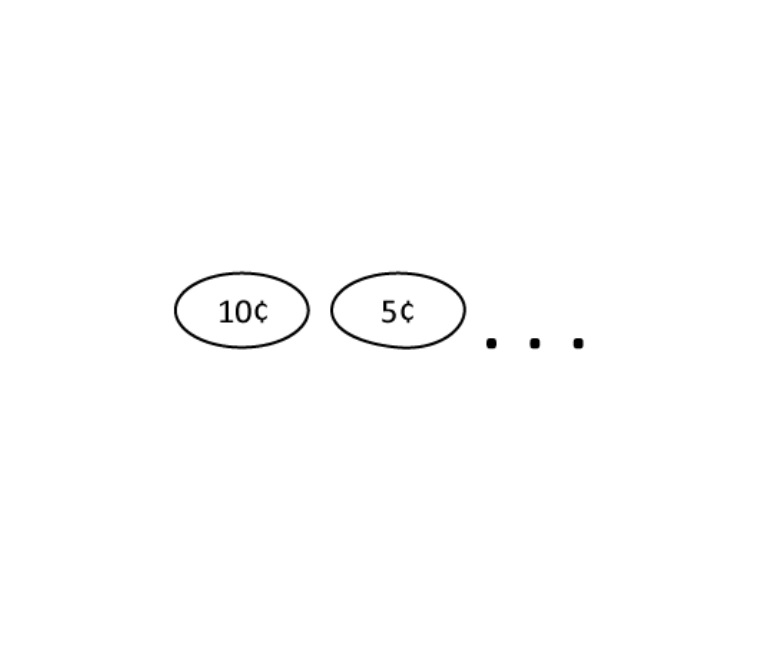
Kevin has 6 coins in his wallet. They are either ten-cent coins or five-cent coins. What is the biggest possible amount of money in his wallet when he has one or more five-cent coins? Express your answer in dollars.
Level 2
Kevin has 6 coins in his wallet. They are either ten-cent coins or five-cent coins. What is the biggest possible amount of money in his wallet when he has one or more five-cent coins? Express your answer in dollars.
Level 2
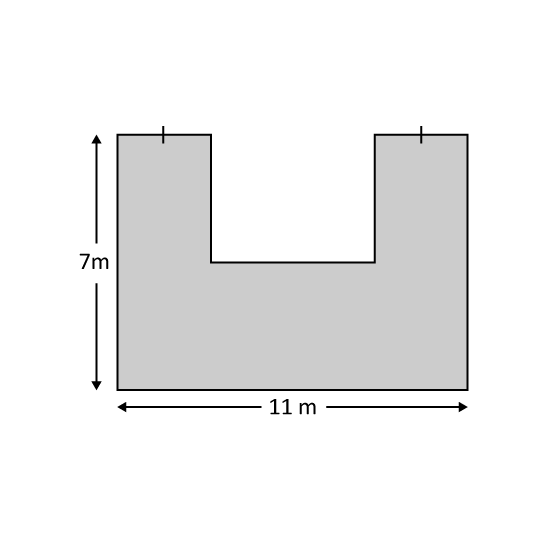
Roy needs to fence up the plot of land as shown. Every metre of fencing material costs $3. How much does he need to pay to fence up the plot of land? (All the lines meet at right angles)
Level 2
Roy needs to fence up the plot of land as shown. Every metre of fencing material costs $3. How much does he need to pay to fence up the plot of land? (All the lines meet at right angles)
Level 3
Adam spends 110 of his money on some marbles
and 35 of his money on some stickers.
Then he buys some beads
and has $80 left.
If he has $600 at first,
how much money does he spend on the beads?
Level 3
Adam spends 14 of his money on some stickers and 13 of the remainder on some marbles. He spends a total of $200 How much does Adam have at first?
Level 2
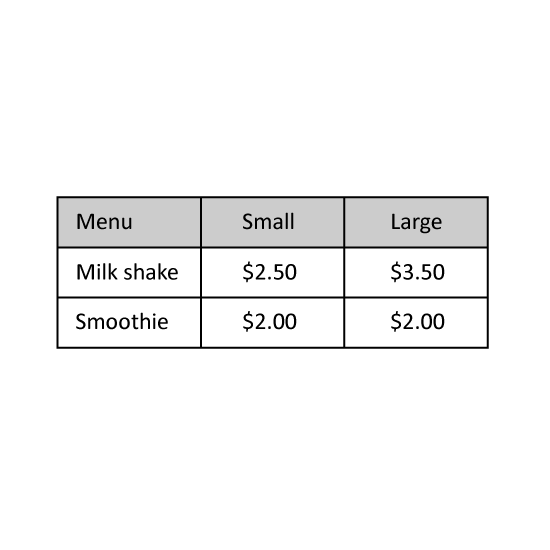
The table shows part of a menu at a fast food restaurant. Benny wanted to buy 1 small smoothie and 1 large milk shake. How much more money would he need if he had only six 50-cent coins in his wallet?
Level 2
The table shows part of a menu at a fast food restaurant. Benny wanted to buy 1 small smoothie and 1 large milk shake. How much more money would he need if he had only six 50-cent coins in his wallet?
Level 3 Ben bought some pastries. He bought some cupcakes with $9.20 more than half his money. He then bought some puffs with $7.20 less than half of his remaining money. He then had $12.80 left. How much did he pay for the cupcakes?
Level 2
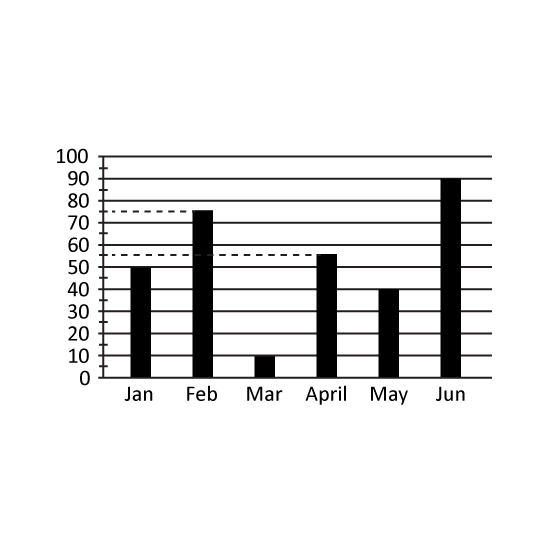
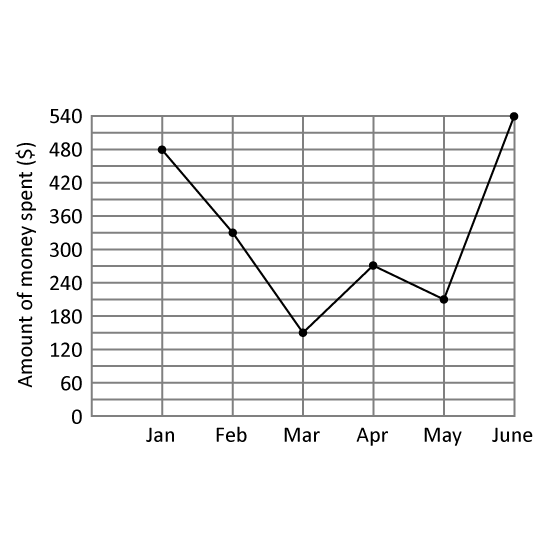
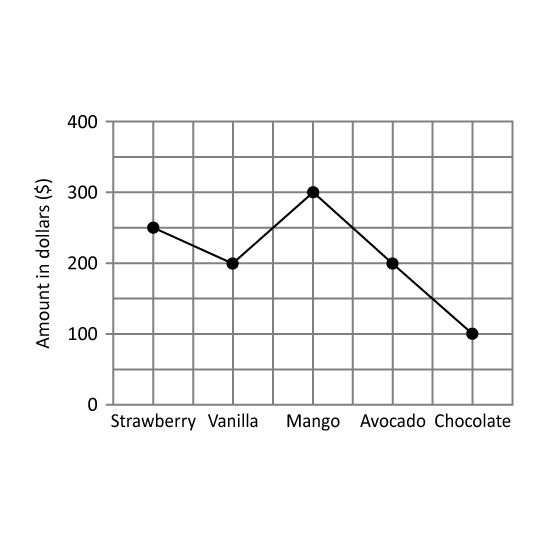
The line graph shows the amount of money Joseph spent from January to June.
Of the amount Joseph spent in February, $138 was spent on clothes and the remaining amount was spent on food. How much did he spend on food in February?
In which month did Joseph spend $120 more than the previous month? Give your answer in this format. (Eg Jan)
Level 2
The line graph shows the amount of money Joseph spent from January to June.
Of the amount Joseph spent in February, $138 was spent on clothes and the remaining amount was spent on food. How much did he spend on food in February?
In which month did Joseph spend $120 more than the previous month? Give your answer in this format. (Eg Jan)