Level 1 PSLE
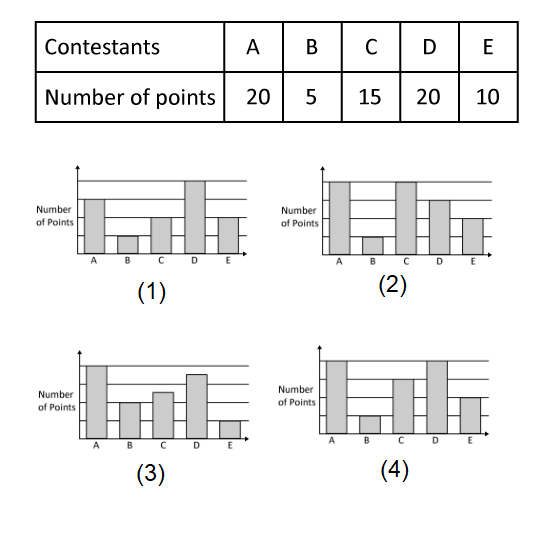
The table shows the points scored by 5 contestants in a game. Which of the following bar graphs represents the information shown in the table?
Level 1 PSLE
The table shows the points scored by 5 contestants in a game. Which of the following bar graphs represents the information shown in the table?
Image in this question is not available.
Level 1
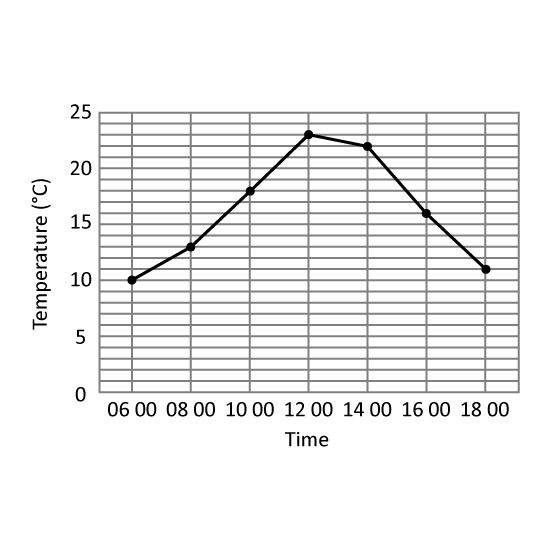
The table shows the temperature change in Hillview Town.
At which 2 hour-interval of the day was there the greatest change in temperature? Give your answer in this format. (Eg 1200 to 1400)
Level 1
The table shows the temperature change in Hillview Town.
At which 2 hour-interval of the day was there the greatest change in temperature? Give your answer in this format. (Eg 1200 to 1400)
Image in this question is not available.
Level 2
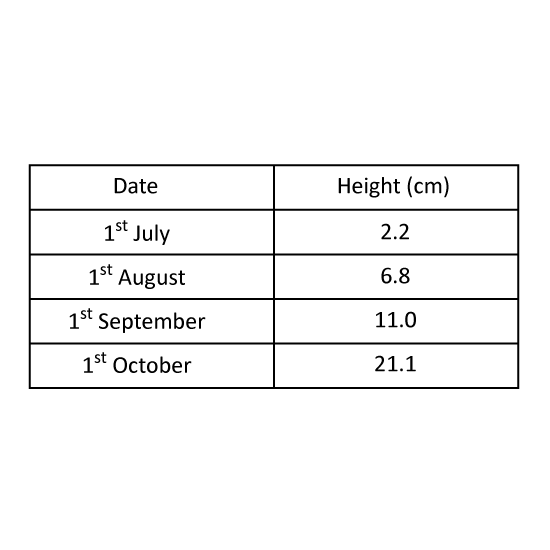
The table shows the height of a plant in centimetres on the first day of each month from July to October. In which month did the plant's height increase the most? Give your answer in this format. (Eg Jan)
Level 2
The table shows the height of a plant in centimetres on the first day of each month from July to October. In which month did the plant's height increase the most? Give your answer in this format. (Eg Jan)
Image in this question is not available.
Level 1
Find the following values without a calculator.
Choose the greatest number.
- 54, 65, 46
- 345, 435, 534
- 443, 344, 343
1 m
Image in this question is not available.
Level 1
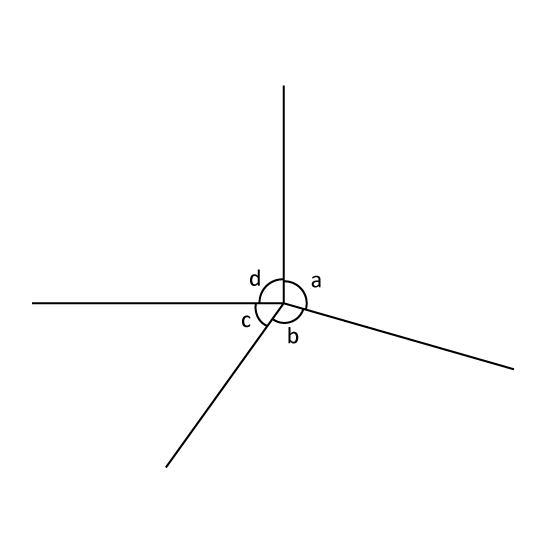
In the figure, name the smallest angle. (Eg ∠ a)
Level 1
In the figure, name the smallest angle. (Eg ∠ a)
Image in this question is not available.
Level 2
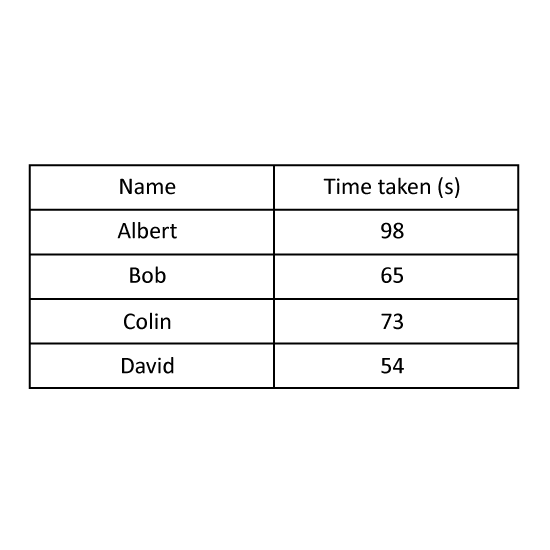
Four boys took part in a race. The table shows the time taken by the four boys.
How much faster was the fastest runner in the race compared to Bob? Give your answer in seconds.
Level 2
Four boys took part in a race. The table shows the time taken by the four boys.
How much faster was the fastest runner in the race compared to Bob? Give your answer in seconds.
Image in this question is not available.
Level 1 PSLE
Arrange the following decimals from the largest to the smallest. Give the answer in letters. (Eg a, b, c, d)
- 7.49
- 7.94
- 7.409
- 7.904
1 m
Image in this question is not available.
Level 1
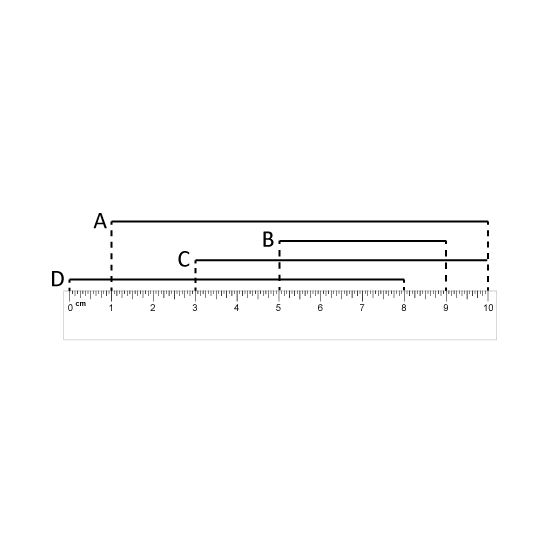
Which stick is the longest? Give the answer in letter. (Eg a)
- A
- B
- C
Level 1
Which stick is the longest? Give the answer in letter. (Eg a)
- A
- B
- C
Image in this question is not available.
Level 1
Find the following values without a calculator.
Arrange the numbers from the biggest to the smallest.
- 54, 65, 46
- 345, 435, 534
- 443, 344, 343
1 m
Image in this question is not available.
Level 1
Arrange the following from the largest to the smallest. Express your answer based on the numbers given in the brackets. (Eg 1, 2, 3, 4)
(1) 1.07
(2) 115
(3) 1.7
(4) 107
1 m
Image in this question is not available.
Level 2 PSLE
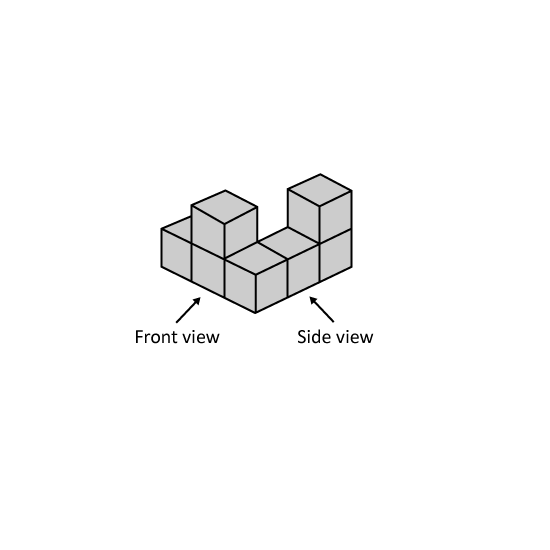
Amy builds a solid using 7 unit cubes. Find the greatest number of unit cubes Amy can add to the solid without changing the front view and side view.
Level 2 PSLE
Amy builds a solid using 7 unit cubes. Find the greatest number of unit cubes Amy can add to the solid without changing the front view and side view.
Image in this question is not available.
Level 1 PSLE
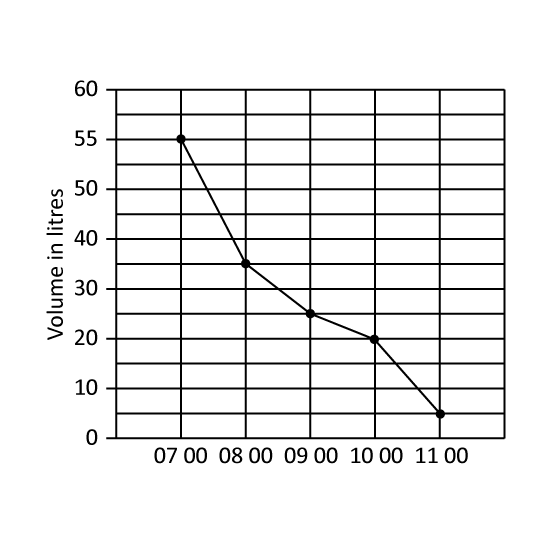
A tank was filled with 55 litre of water at 07 00. Water flowed out of the tank from 07 00 to 11 00. The line graph shows the amount of water in the tank from 07 00 to 11 00.
During which one-hour period was the decrease in the volume of water the greatest?
Give your answer in number. (Eg 1)
(1) From 0700 to 0800
(2) From 0700 to 0900
(3) From 0900 to 1000
(4) From 1000 to 1100
Level 1 PSLE
A tank was filled with 55 litre of water at 07 00. Water flowed out of the tank from 07 00 to 11 00. The line graph shows the amount of water in the tank from 07 00 to 11 00.
During which one-hour period was the decrease in the volume of water the greatest?
Give your answer in number. (Eg 1)
(1) From 0700 to 0800
(2) From 0700 to 0900
(3) From 0900 to 1000
(4) From 1000 to 1100
Image in this question is not available.
Level 1
Angela listed 3 decimals.
4.7, 2.09, 3.52
Find the greatest possible sum using two of the decimals.
1 m
Image in this question is not available.
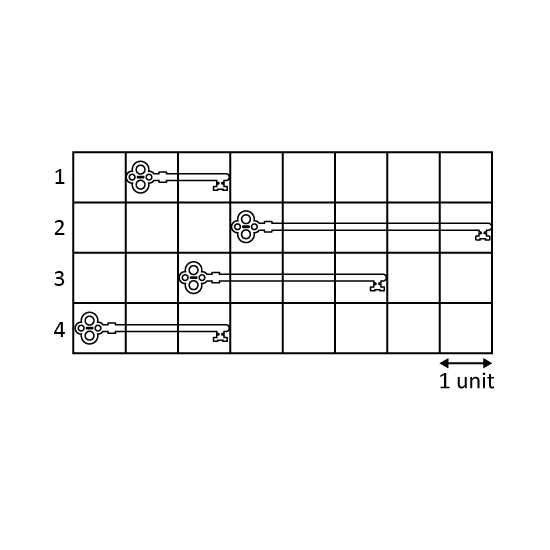
Level 2
Look at the picture. Give the answers in numbers.
Key _____ (a) is the longest and Key _____ (b) is the shortest.
Level 2
Look at the picture. Give the answers in numbers.
Key _____ (a) is the longest and Key _____ (b) is the shortest.
Image in this question is not available.
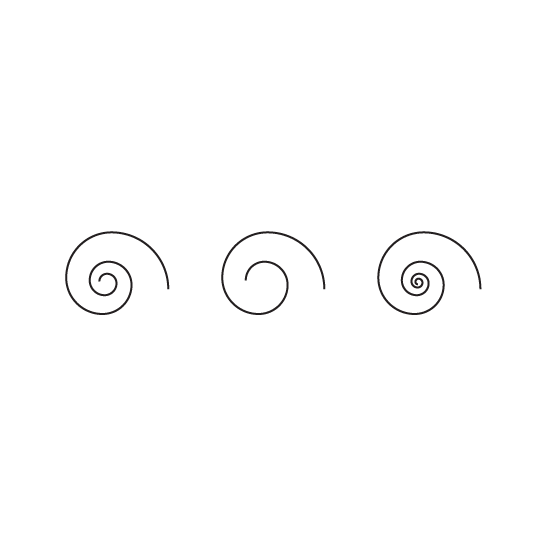
Level 1
Which rope is the longest? Give the answer in letter. (Eg a)
- A
- B
- C
Level 1
Which rope is the longest? Give the answer in letter. (Eg a)
- A
- B
- C
Image in this question is not available.
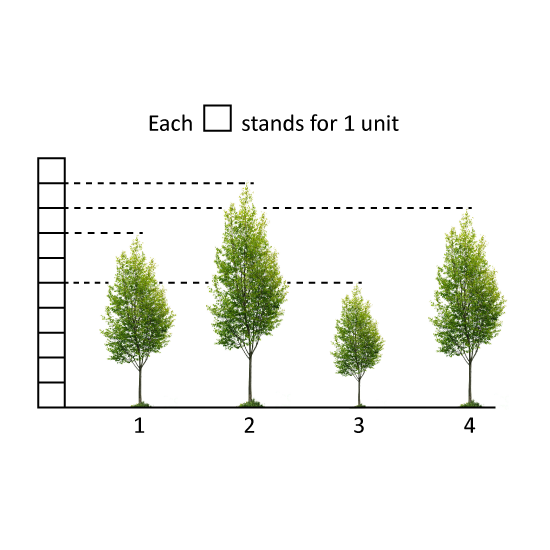
Level 2
Look at the picture. Give the answers in numbers.
Tree _____ (a) is the tallest and Tree_____ (b) is the shortest.
Level 2
Look at the picture. Give the answers in numbers.
Tree _____ (a) is the tallest and Tree_____ (b) is the shortest.
Image in this question is not available.
Level 1 PSLE
Three volumes are given.
1.2ℓ, 1
12ℓ, 1ℓ 2 mℓ
- Which is the smallest?
- Which is the largest?
1 m
Image in this question is not available.
Level 1 PSLE
Which is the biggest? Give the answer only in letter. (Eg a)
- 0.405
- 0.045
- 0.054
1 m
Image in this question is not available.
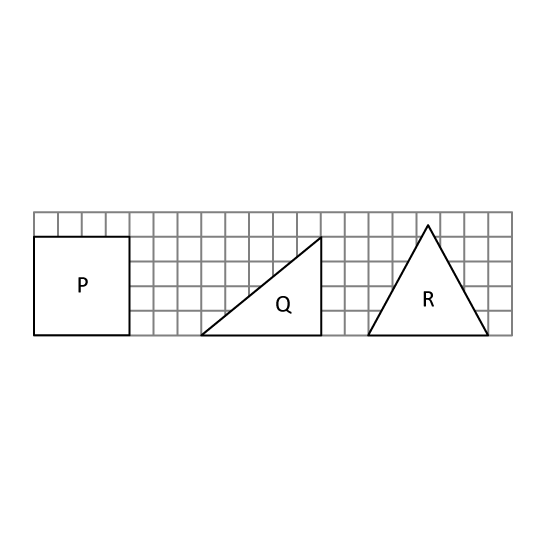
Level 1 PSLE
In the square grid, P is a square, Q is a right-angled triangle and R is an equilateral triangle. Arrange P, Q and R from the smallest area to the largest.
Level 1 PSLE
In the square grid, P is a square, Q is a right-angled triangle and R is an equilateral triangle. Arrange P, Q and R from the smallest area to the largest.
Image in this question is not available.
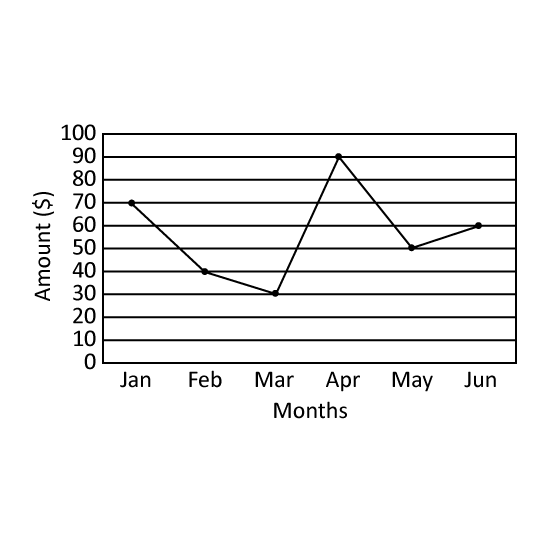
Level 1
The line graph shows the amount of utility bills paid by Mr Gann's household in the first six months of the year. In which month did the greatest decrease in utility bills occur? Give the answer in short form. (Eg Jan)
Level 1
The line graph shows the amount of utility bills paid by Mr Gann's household in the first six months of the year. In which month did the greatest decrease in utility bills occur? Give the answer in short form. (Eg Jan)
Image in this question is not available.