Level 2
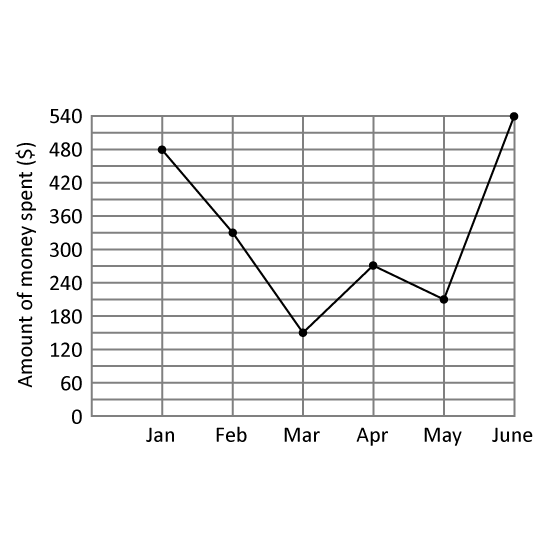
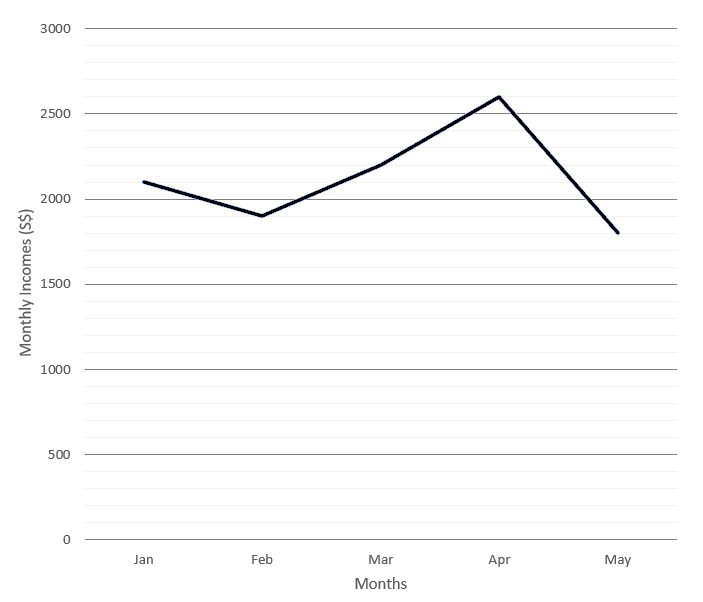
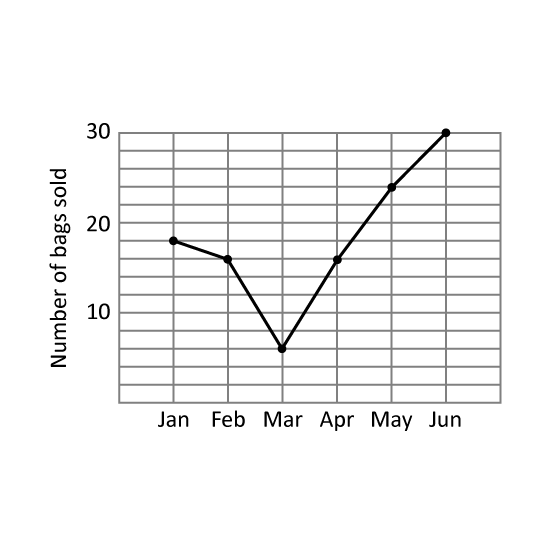
The line graph shows the amount of money Joseph spent from January to June.
Of the amount Joseph spent in February, $138 was spent on clothes and the remaining amount was spent on food. How much did he spend on food in February?
In which month did Joseph spend $120 more than the previous month? Give your answer in this format. (Eg Jan)
Level 2
The line graph shows the amount of money Joseph spent from January to June.
Of the amount Joseph spent in February, $138 was spent on clothes and the remaining amount was spent on food. How much did he spend on food in February?
In which month did Joseph spend $120 more than the previous month? Give your answer in this format. (Eg Jan)
Level 3
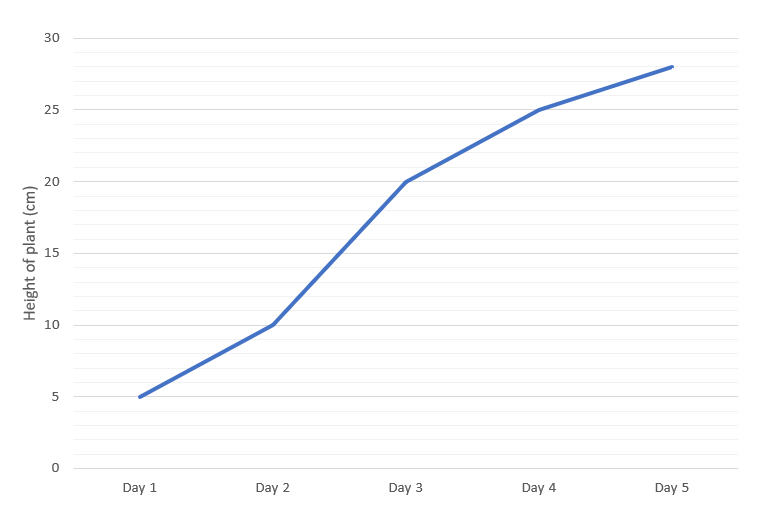
Marissa bought a plant that was 5 cm tall. Every morning, she measured the height of the plant and recorded its height for the day. The line graph shows her records.
What was the height of the plant when it was measured on Day 3?
Between which two days was the increase in the height of the plant the greatest? Give the answer in numbers. (Eg 1, 2)
In Day 6, the height of the plant dropped to 35 of Day 4. What is the height of the plant on Day 6?
Level 3
Marissa bought a plant that was 5 cm tall. Every morning, she measured the height of the plant and recorded its height for the day. The line graph shows her records.
What was the height of the plant when it was measured on Day 3?
Between which two days was the increase in the height of the plant the greatest? Give the answer in numbers. (Eg 1, 2)
In Day 6, the height of the plant dropped to 35 of Day 4. What is the height of the plant on Day 6?
Level 2 PSLE
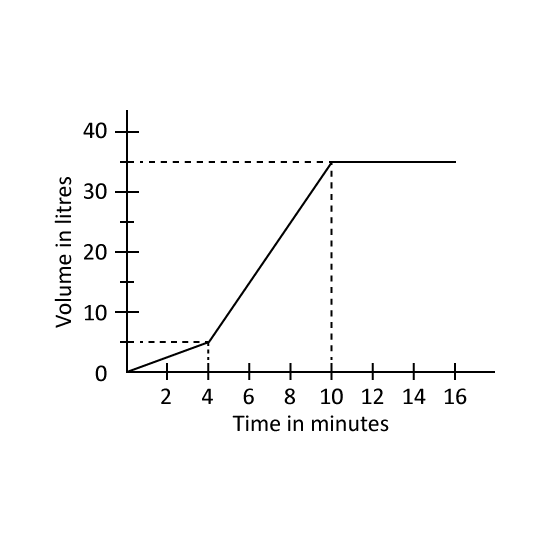
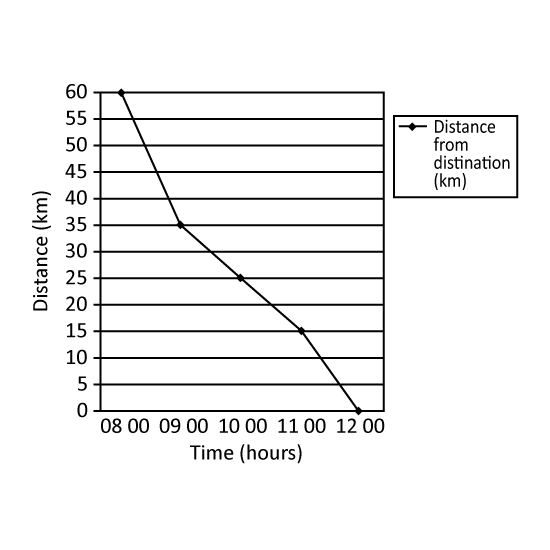
Carlo filled a container with water using two taps. He turned on Tap A first and after 4 minutes, he also turned on Tap B. Both taps were turned off at the same time when the container was completely filled without overflowing. The graph shows the amount of water in the container over 16 minutes.
What fraction of the container was filled 4 minutes after Tap A was turned on? Express your answer in the simplest form.
In one minute, how many litres of water flowed from Tap B?
Level 2 PSLE
Carlo filled a container with water using two taps. He turned on Tap A first and after 4 minutes, he also turned on Tap B. Both taps were turned off at the same time when the container was completely filled without overflowing. The graph shows the amount of water in the container over 16 minutes.
What fraction of the container was filled 4 minutes after Tap A was turned on? Express your answer in the simplest form.
In one minute, how many litres of water flowed from Tap B?
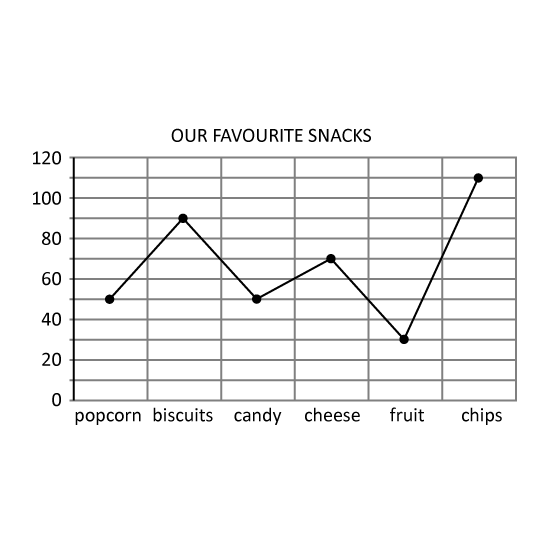
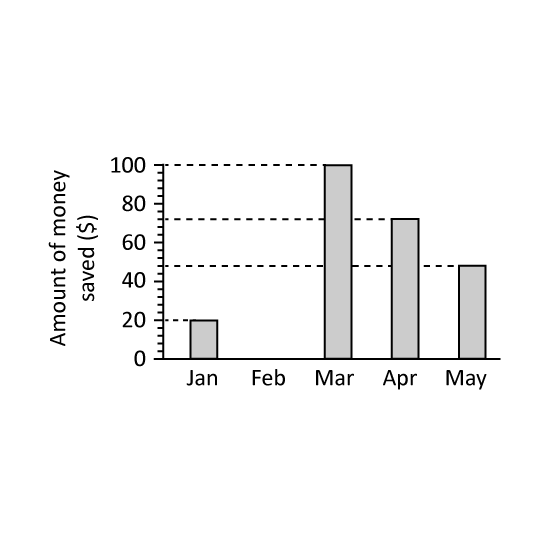
Level 2 The graph shows the amount of money Ron saved from his pocket money every month from January to May.
How much money did Ron save altogether from January to May?
What was the average amount of money Ron saved from January to May?
Ron saved $80 in June. The amount saved increased by 100% from June to July and another 100% from July to August. How much money did Ron save in August?
Level 3
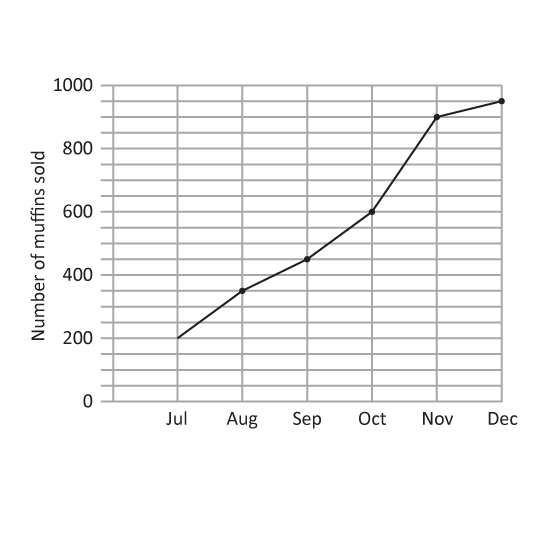
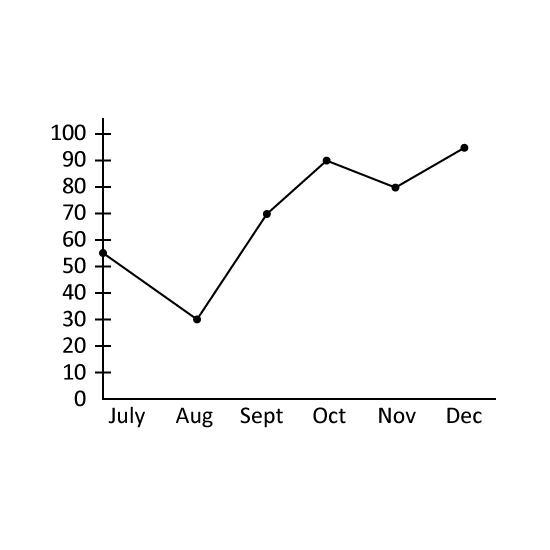
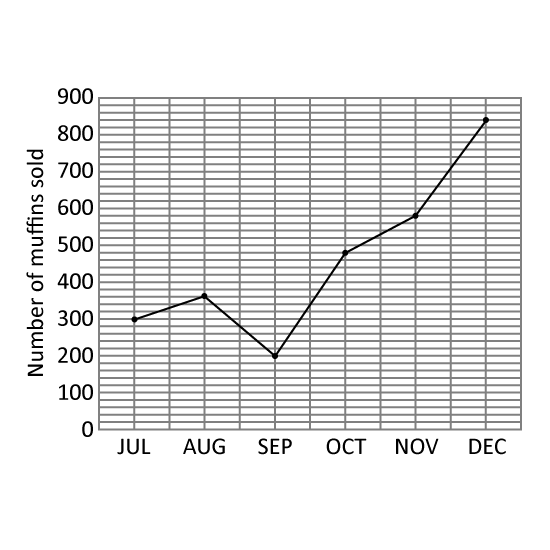
The line graph shows the number of dresses sold by a shop from July to December in 2013.
What was the average number of dresses sold per month from July to December in 2013?
The total number of dresses sold for the same period from July to December in 2012 was 672. Find the percentage decrease in the total number of dresses sold for the same period from 2012 to 2013.
Level 3
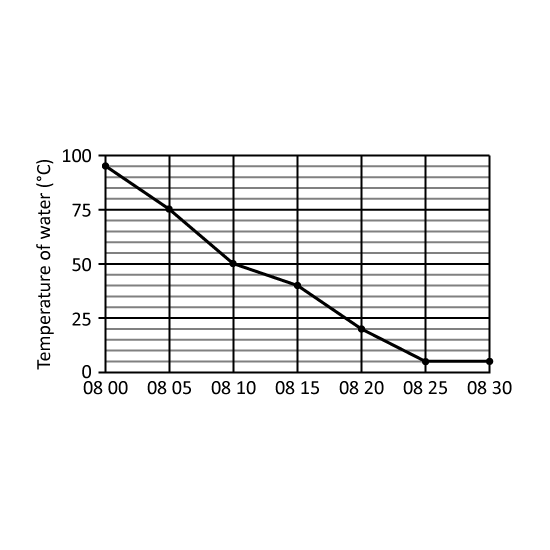
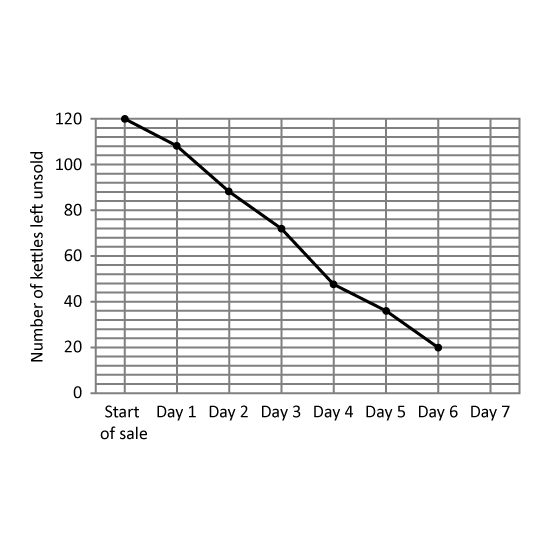
A departmental store had 120 kettles for sale during a 7-day period. The line graph shows the number of kettles left unsold at the end of each day. The number of kettles left unsold at the end of Day 7 was not shown.
On which day (from Day 1 to Day 7), was the greatest number of kettles sold? Give your answer in number. (Eg 1)
The average number of kettles sold for the last three days was 14. How many kettles were sold on Day 7?
Level 3
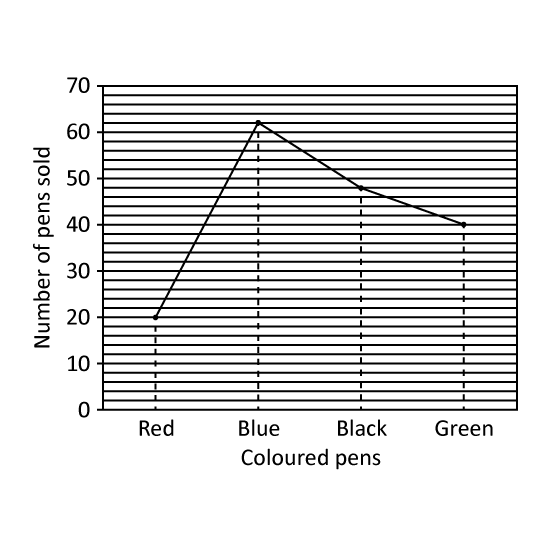
The line graph shows the number of boys and girls in each sports school.
How many pupils were there in Sports School B?
How many more girls than boys were there in Sports School C?
At the end of the year, an equal number of boys and girls from Sports School D were transferred to Sports School A. The fraction of the number of boys to girls in Sports School A becomes 23. Find the total number of boys and girls that were transferred from Sports School D to Sports School A.