Level 2
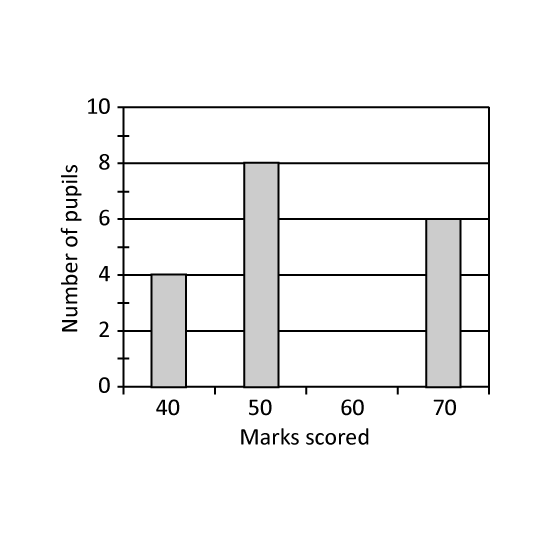
The bar graph shows the exam results of a group of pupils. How many pupils who scored 60 marks, given that 12 of the pupils scored 50 marks and below.
Level 2
The bar graph shows the exam results of a group of pupils. How many pupils who scored 60 marks, given that 12 of the pupils scored 50 marks and below.
Level 3
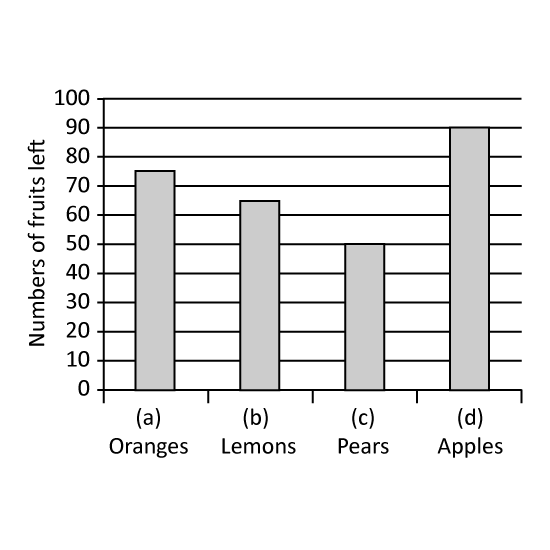
A fruit seller displayed the same amount of each type of fruits for sale every morning from Monday to Saturday in a week. She charted each type of fruits which were left unsold at the end of the week as shown in the graph.
Which type of fruit was the most popular?
If she had 720 fruits in the beginning of the week, how many fruits did she sell in the week?
Level 3
A fruit seller displayed the same amount of each type of fruits for sale every morning from Monday to Saturday in a week. She charted each type of fruits which were left unsold at the end of the week as shown in the graph.
Which type of fruit was the most popular?
If she had 720 fruits in the beginning of the week, how many fruits did she sell in the week?