Level 1 PSLE
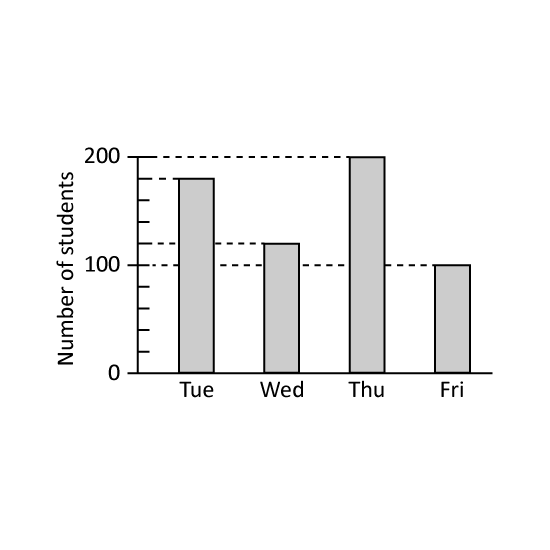
A school conducted checks on its Primary 6 students' eyesight from Tuesday to Friday. Each student had their eyes checked on one of the four days. The bar graph shows the number of students that were checked on each day. What percentage of the Primary 6 students had their eyes checked on Tuesday?
Level 1 PSLE
A school conducted checks on its Primary 6 students' eyesight from Tuesday to Friday. Each student had their eyes checked on one of the four days. The bar graph shows the number of students that were checked on each day. What percentage of the Primary 6 students had their eyes checked on Tuesday?
Level 2 PSLE
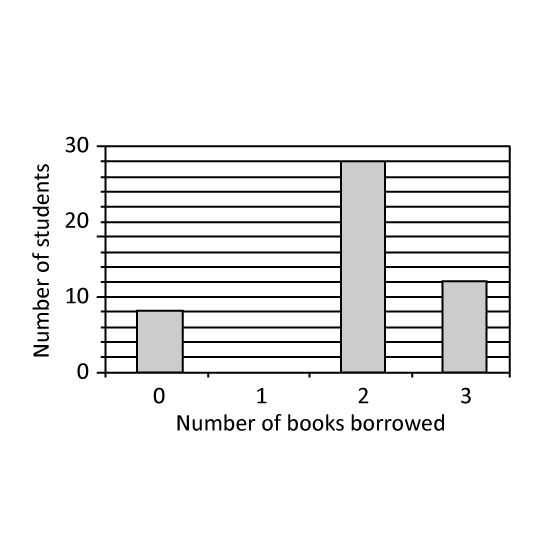
The bar graph shows the number of books borrowed by students in the school library. 14 of the students borrowed 1 book each. How many students borrowed 1 book each?
Level 2 PSLE
The bar graph shows the number of books borrowed by students in the school library. 14 of the students borrowed 1 book each. How many students borrowed 1 book each?
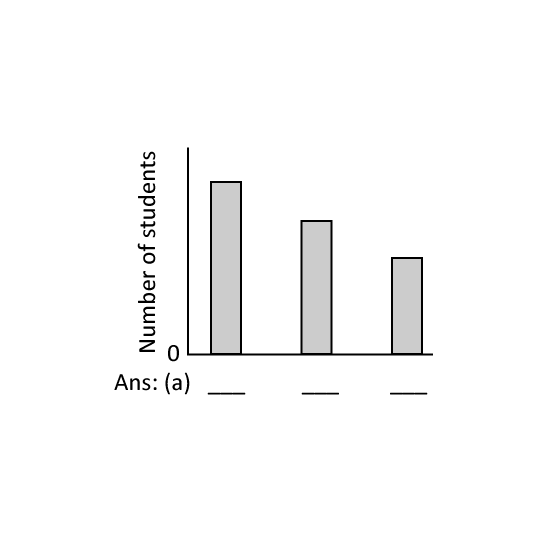
Level 2 PSLE Students played only one sport - basketball, football or volleyball. 13 of them played football. The number who played volleyball was 12 of the number who played basketball.
Identify the sports of each bar. Give your answers in letters in the following sequence: Bar 1, Bar 2, Bar 3 by using the first letter of the sport. (Eg B, V, F for Basketball, Volleyball, Football)
What fraction of the students played basketball?
Level 2 PSLE Students played only one sport - basketball, football or volleyball. 13 of them played football. The number who played volleyball was 12 of the number who played basketball.
Identify the sports of each bar. Give your answers in letters in the following sequence: Bar 1, Bar 2, Bar 3 by using the first letter of the sport. (Eg B, V, F for Basketball, Volleyball, Football)
Level 2 PSLE
School camp T-shirts were available in 4 colours: black, blue, red and white. At the camp, each child chose one T-shirt. The pie chart represents the children's choice of T-shirt colours. 40 children chose black T-shirts. The children's choice of T-shirt colours is also represented by the bar graph. The bar that shows the number of children who chose blue T-shirts has not been drawn. How many children chose blueT-shirts?