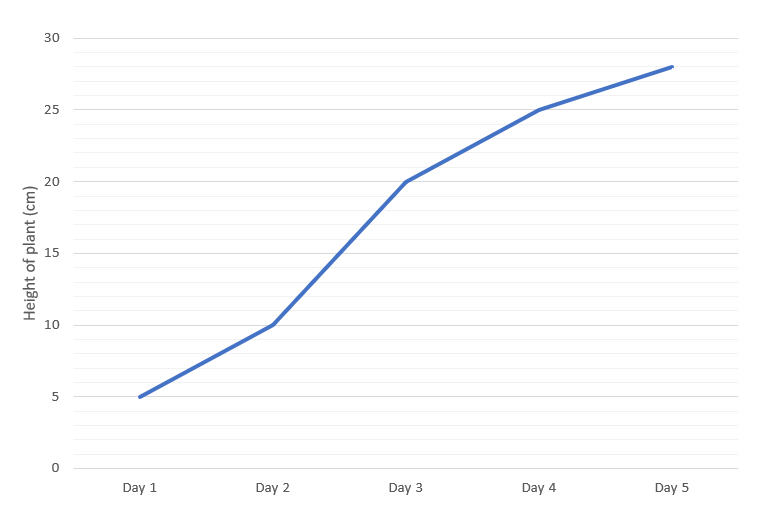
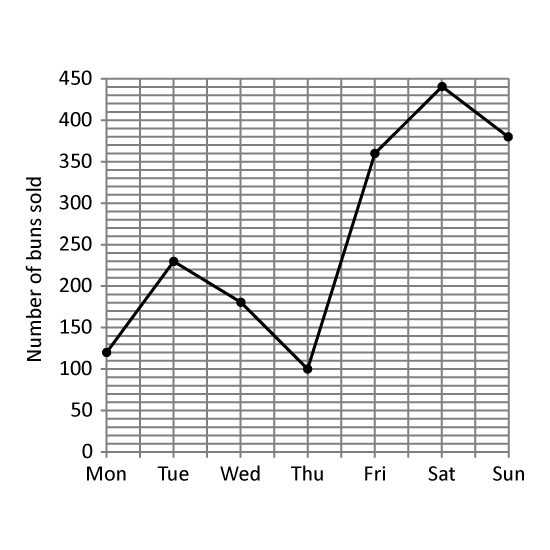
Level 3
Marissa bought a plant that was 5 cm tall. Every morning, she measured the height of the plant and recorded its height for the day. The line graph shows her records.
What was the height of the plant when it was measured on Day 3?
Between which two days was the increase in the height of the plant the greatest? Give the answer in numbers. (Eg 1, 2)
In Day 6, the height of the plant dropped to 35 of Day 4. What is the height of the plant on Day 6?
Level 3
The line graph shows the number of boys and girls in each sports school.
How many pupils were there in Sports School B?
How many more girls than boys were there in Sports School C?
At the end of the year, an equal number of boys and girls from Sports School D were transferred to Sports School A. The fraction of the number of boys to girls in Sports School A becomes 23. Find the total number of boys and girls that were transferred from Sports School D to Sports School A.
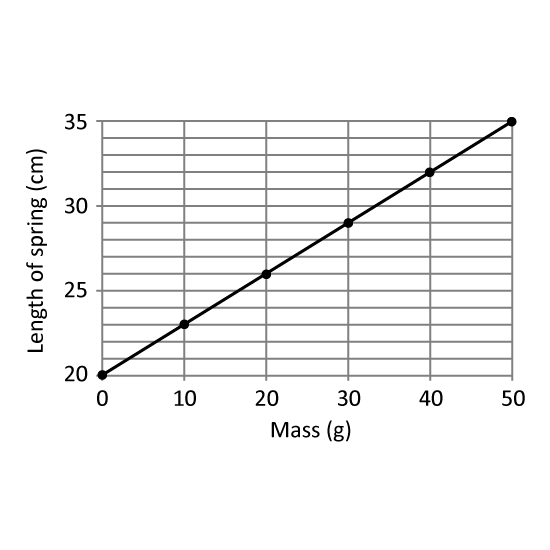
Level 3
The line graph shows the total number of cars sold by a car dealer in the first six months of the year.
In which two months were there a consecutive increase in the number of cars sold? Give the answer in short form. (Eg Jan, Feb)
What fraction of the cars was sold in the month of the lowest sale?
The car dealer was paid a fixed amount of money for every car he sold. He received $3200 more in April than in February. How much money did he receive from selling a car?