Level 1 PSLE
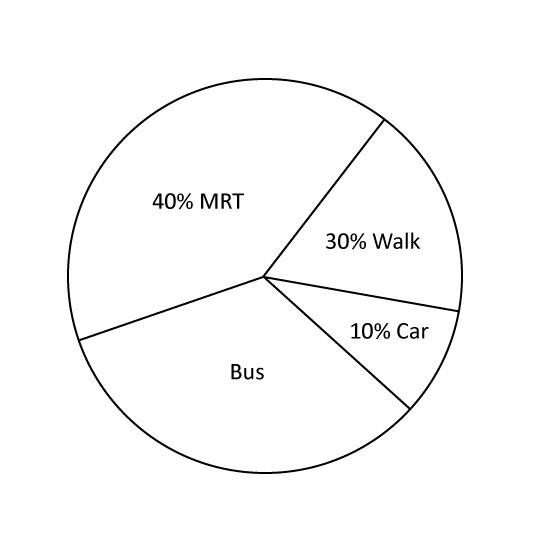
The pie chart shows the different ways a group of workers go to work. What is the ratio of number of workers who walk to work to the number who go by bus?
Level 1 PSLE
The pie chart shows the different ways a group of workers go to work. What is the ratio of number of workers who walk to work to the number who go by bus?
Image in this question is not available.
Level 2 PSLE
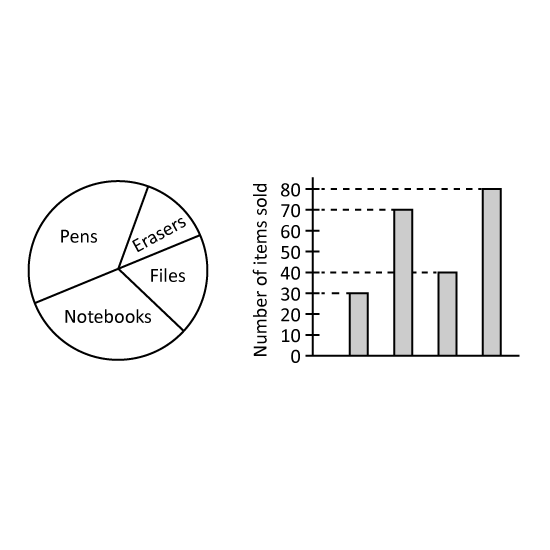
The pie chart shows the number of pens, erasers, file and notebook sold by a shop. The same information is shown in a bar graph, but the names of the items are not shown on the bar graph.
How many less erasers than pens are sold?
Level 2 PSLE
The pie chart shows the number of pens, erasers, file and notebook sold by a shop. The same information is shown in a bar graph, but the names of the items are not shown on the bar graph.
How many less erasers than pens are sold?
Image in this question is not available.
Level 1 PSLE
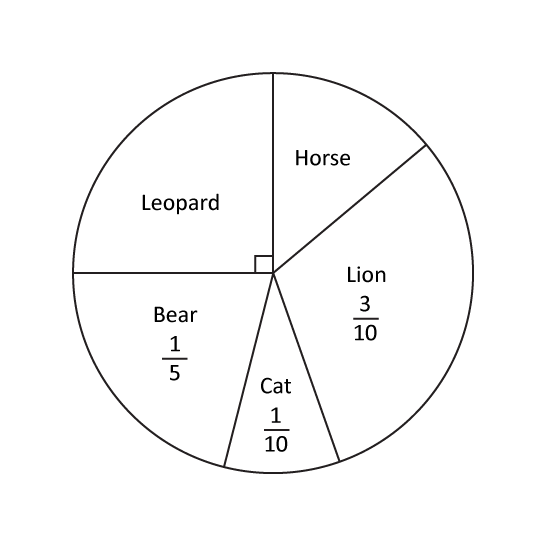
In a class, each pupil chose one animal for their class banner. The pie chart shows their choices. What fraction of the class chose Horse?
Level 1 PSLE
In a class, each pupil chose one animal for their class banner. The pie chart shows their choices. What fraction of the class chose Horse?
Image in this question is not available.
Level 2
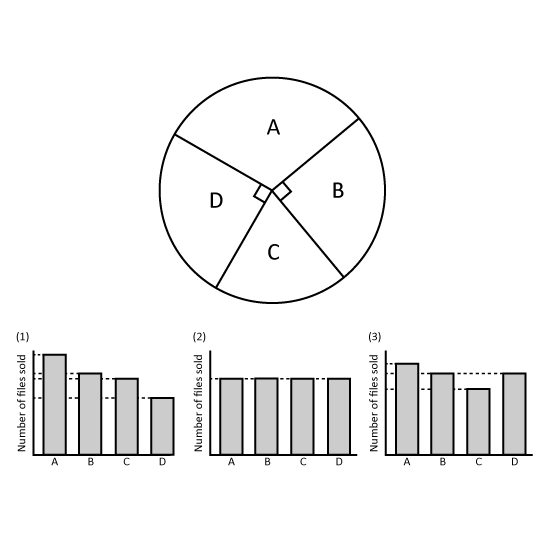
The pie chart shows the number of three types of files sold by a bookstore last week. Which bar graph best represents the information in the pie chart? Give your answer in number. (Eg 1)
Level 2
The pie chart shows the number of three types of files sold by a bookstore last week. Which bar graph best represents the information in the pie chart? Give your answer in number. (Eg 1)
Image in this question is not available.
Level 2 PSLE
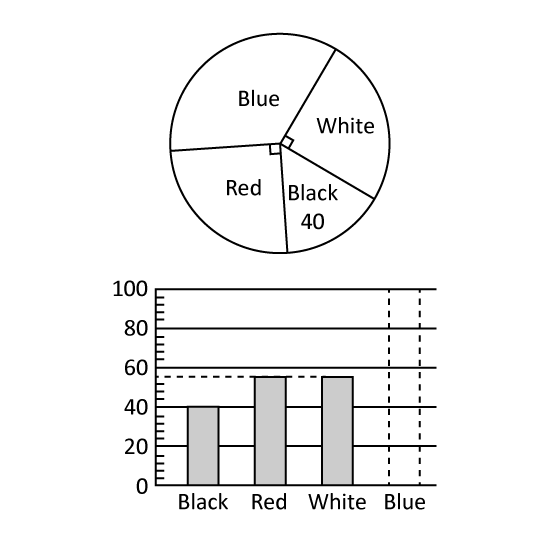
School camp T-shirts were available in 4 colours: black, blue, red and white. At the camp, each child chose one T-shirt. The pie chart represents the children's choice of T-shirt colours. 40 children chose black T-shirts. The children's choice of T-shirt colours is also represented by the bar graph. The bar that shows the number of children who chose blue T-shirts has not been drawn. How many children chose blueT-shirts?
Image in this question is not available.
