Level 2
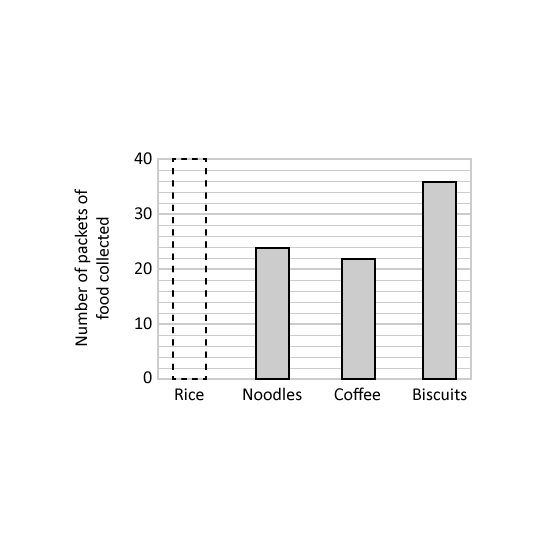
The bar graph shows the number of packets of different food collected in a donation drive.
15 of the total number of packets of food collected was coffee. How many packets of rice were collected?
The table shows the mass of each packet of food. What is the difference between the total mass of noodles collected and the total mass of biscuits collected? Give your answer in kg.
Level 2
The bar graph shows the number of packets of different food collected in a donation drive.
15 of the total number of packets of food collected was coffee. How many packets of rice were collected?
The table shows the mass of each packet of food. What is the difference between the total mass of noodles collected and the total mass of biscuits collected? Give your answer in kg.