Level 2 PSLE
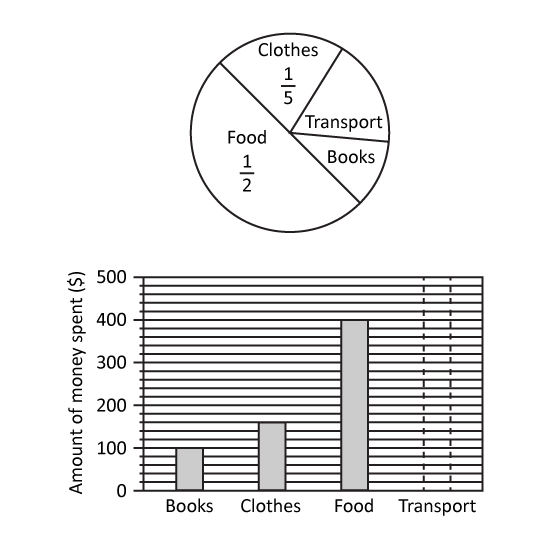
The pie chart shows how Zoe spent her money. The amount of money spent is also represented by the bar graph.
  1. What percentage of her money did Zoe spend on food?
  2. What fraction of her money did Zoe spend on books?
  3. How much of her money was spent on transport?
5 m
Level 3
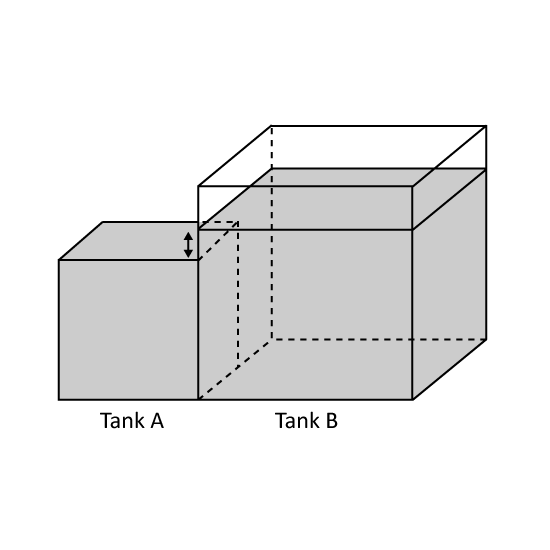
The figure is not drawn to scale. It shows a container made of two connected cubical tanks, A and B. Tank A is sealed at the top and completely filled to the brim. Tank B is 35 filled with 129600 mℓ of water. The height of the water level in Tank B is 1 cm higher than that in Tank A. The height of Tank B is 60 cm. Water is then drained from the container and the height of the water level from the base falls to 30 cm.
  1. What is the capacity of Tank B?
  2. What is the volume of water in the tank now in litres?
5 m
Level 3
The average points accumulated by 6 children is 91.5. They have all attained different points which are whole numbers. The lowest point is 70 while the highest point is 100.
  1. Find the average points achieved by the 4 children whose marks lie between the highest and the lowest.
  2. Find the smallest possible second lowest mark among these 6 children.
  3. Find the largest possible second lowest mark among these 6 children.
5 m
Level 3
Building A and Building B were 360 km apart. A car travelled from Building A towards Building B. At the same time, a bus started from Building B to Building A. After travelling 112 hours, the two vehicles were still 144 km apart. If the ratio of the average speed of the bus to that of the car was 4 : 5, find
  1. the average speed of the bus.
  2. the time taken for them to meet. travelling the rest of the journey
4 m
Level 3
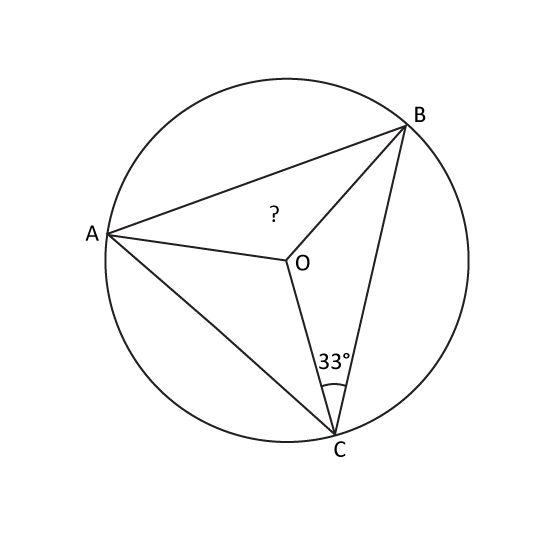
In the figure, not drawn to scale, O is the centre of the circle. Given that the ratio of ∠OBC : ∠AOC is 3 : 11. Find ∠AOB.
4 m