Level 1 PSLE
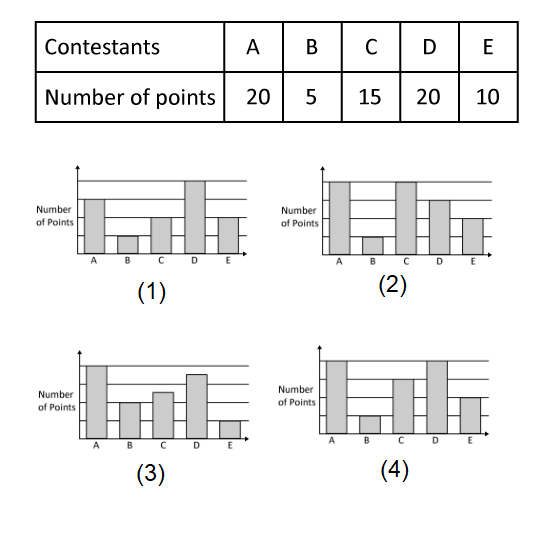
The table shows the points scored by 5 contestants in a game. Which of the following bar graphs represents the information shown in the table above?
Level 1 PSLE
The table shows the points scored by 5 contestants in a game. Which of the following bar graphs represents the information shown in the table above?
Level 1
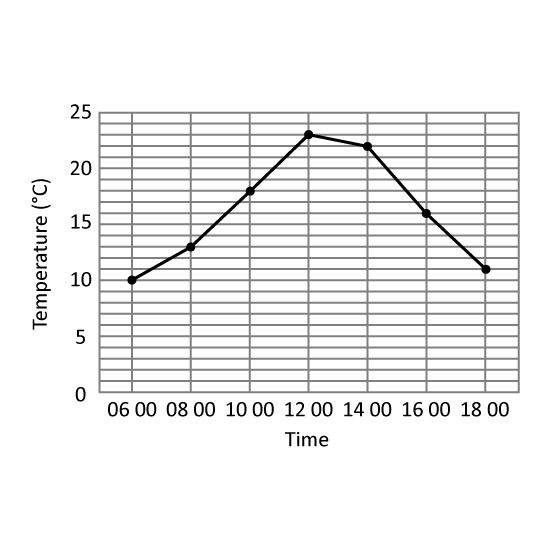
The table shows the temperature change in Hillview Town.
At which 2 hour-interval of the day was there the greatest change in temperature? Give your answer in this format. (Eg 1200 to 1400)
Level 1
The table shows the temperature change in Hillview Town.
At which 2 hour-interval of the day was there the greatest change in temperature? Give your answer in this format. (Eg 1200 to 1400)
Level 2
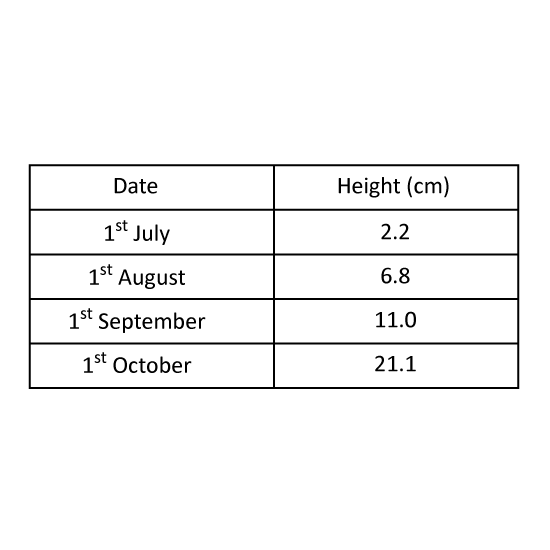
The table shows the height of a plant in centimetres on the first day of each month from July to October. In which month did the plant's height increase the most? Give your answer in this format. (Eg Jan)
Level 2
The table shows the height of a plant in centimetres on the first day of each month from July to October. In which month did the plant's height increase the most? Give your answer in this format. (Eg Jan)
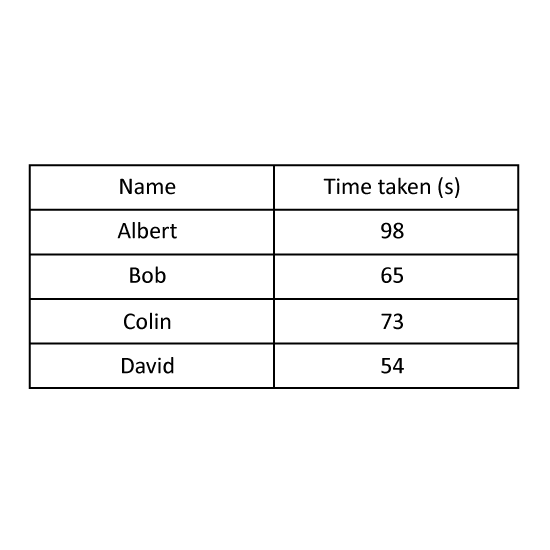
Level 2
Four boys took part in a race. The table shows the time taken by the four boys.
How much faster was the fastest runner in the race compared to Bob? Give your answer in seconds.
Level 2
Four boys took part in a race. The table shows the time taken by the four boys.
How much faster was the fastest runner in the race compared to Bob? Give your answer in seconds.
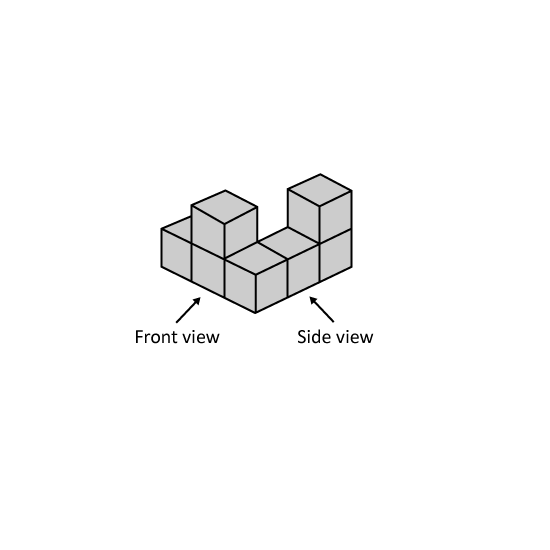
Level 2 PSLE
Amy builds a solid using 7 unit cubes. Find the greatest number of unit cubes Amy can add to the solid without changing the front view and side view.
Level 2 PSLE
Amy builds a solid using 7 unit cubes. Find the greatest number of unit cubes Amy can add to the solid without changing the front view and side view.