Level 2
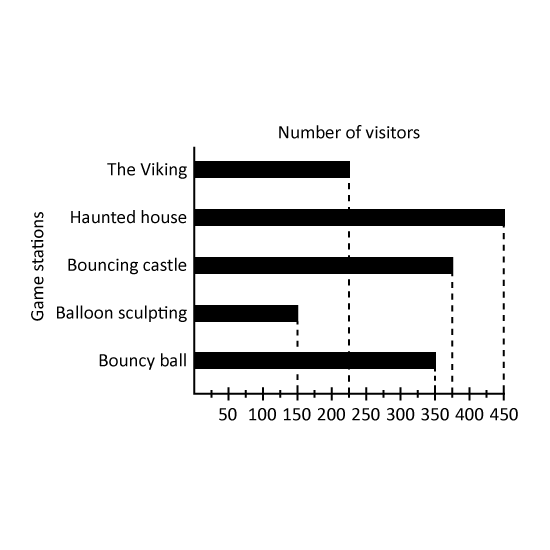
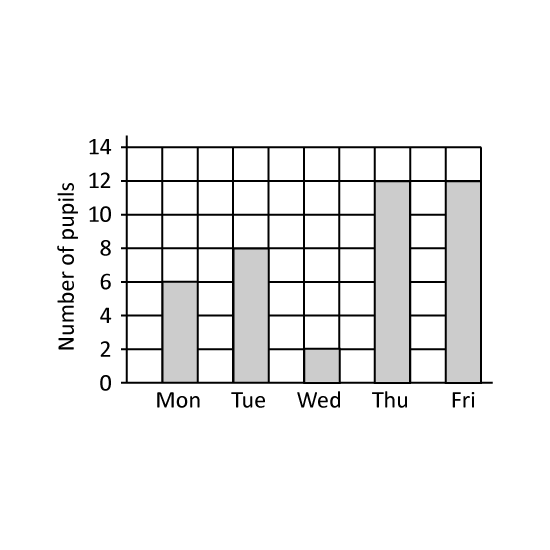
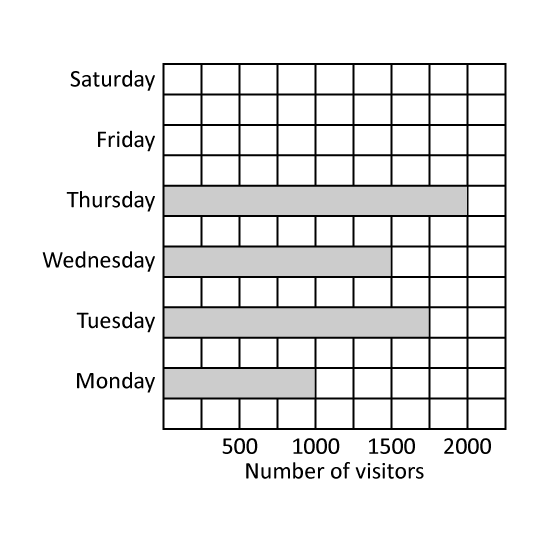
The graph shows the number of visitors to the amusement park. 2 times as many visitors visited the amusement park on Friday as on Monday. How many visitors visited the amusement park on Friday?
Level 2
The graph shows the number of visitors to the amusement park. 2 times as many visitors visited the amusement park on Friday as on Monday. How many visitors visited the amusement park on Friday?
Level 1
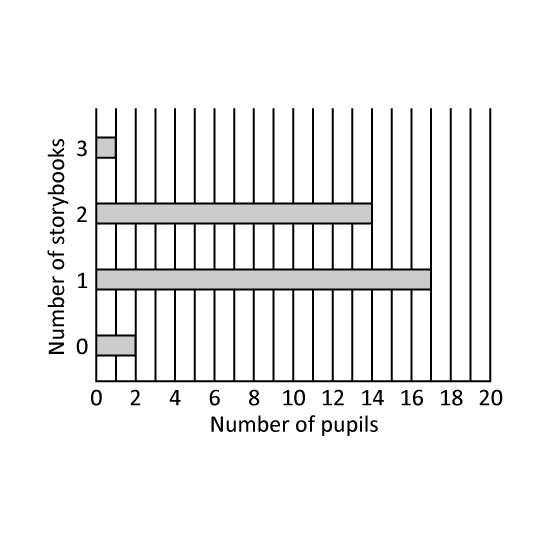
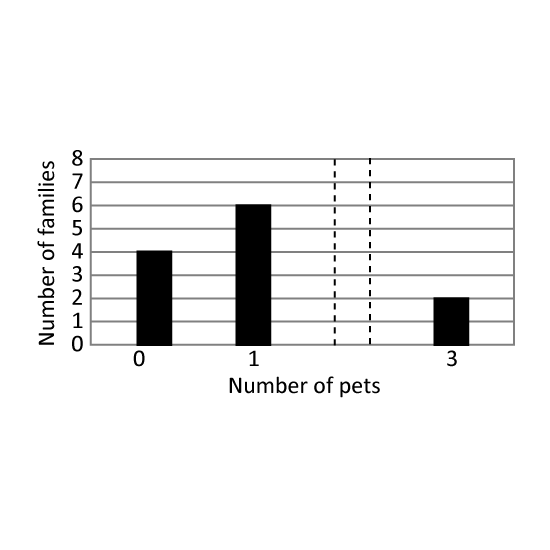
The bar graph shows the number of pets owned by the families living in a block of flats. There are a total of 20 pets in the block. The bar that shows the number of families that has 2 pets is not drawn. How many families have 2 pets?
Level 1
The bar graph shows the number of pets owned by the families living in a block of flats. There are a total of 20 pets in the block. The bar that shows the number of families that has 2 pets is not drawn. How many families have 2 pets?
Level 1
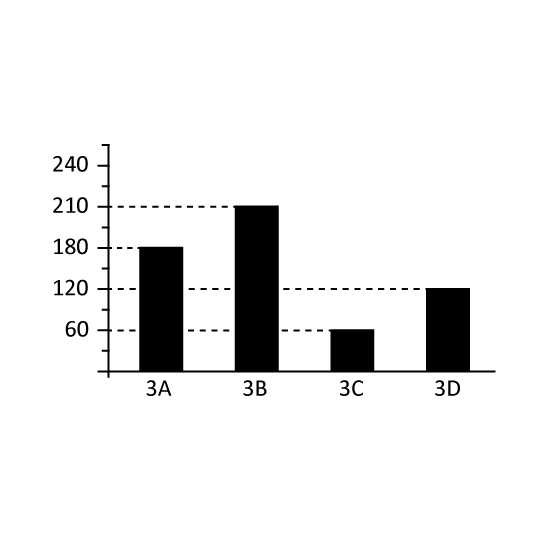
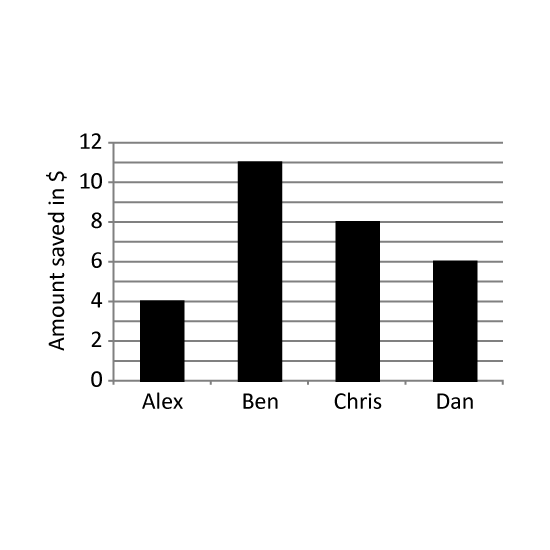
Four friends were given a sum of $25 each. The bar graph shows the amount of money saved by each of them in the week. How much did they spend together?
Level 1
Four friends were given a sum of $25 each. The bar graph shows the amount of money saved by each of them in the week. How much did they spend together?
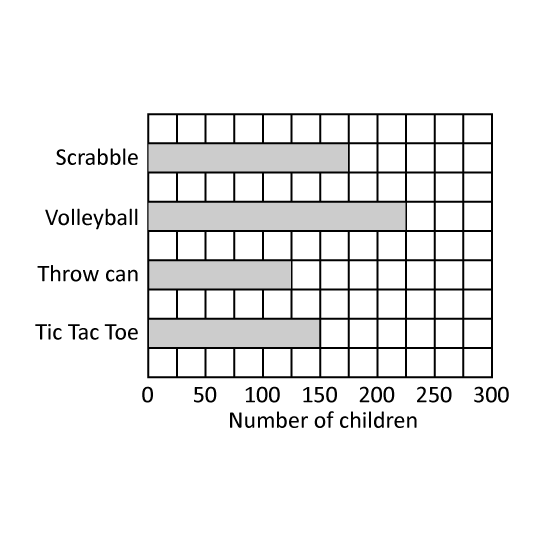
Level 2
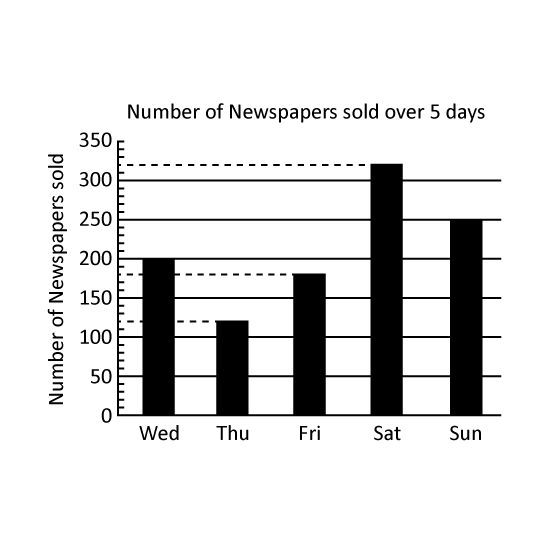
The graph shows the number of students who visited the library. 500 fewer students visited the library on Saturday than on Monday. How many students visited the amusement park on Saturday?
Level 2
The graph shows the number of students who visited the library. 500 fewer students visited the library on Saturday than on Monday. How many students visited the amusement park on Saturday?