Level 2
The graph shows the amount of money Amy earned from selling ice cream over five days. How much less did she earn on Tuesday than on Friday?
2 m
Level 2
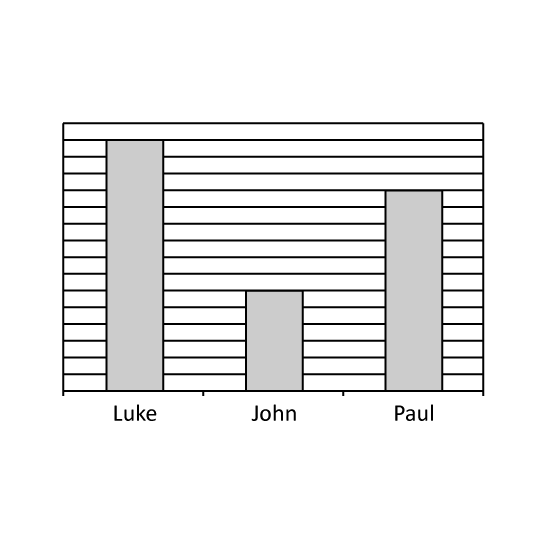
The graph shows the number of marks each child scored for their Math test. How many marks did Paul score if Luke scored 54 marks more than John?
2 m
Level 3
The graph shows the number of books borrowed by the Primary Three students in Happy View Primary School
  1. How many students borrowed more than 2 books?
  2. If there are 150 primary three students in the school, how many primary three students did not borrow any books?
4 m
Level 3
The graph shows the amount of savings 3 children had.
  1. How much money must Betty give Charles so that they will have the same amount of money?
  2. How much money must Adeline give Charles so that Charles will have $2 more than her?
4 m