Level 2 PSLE
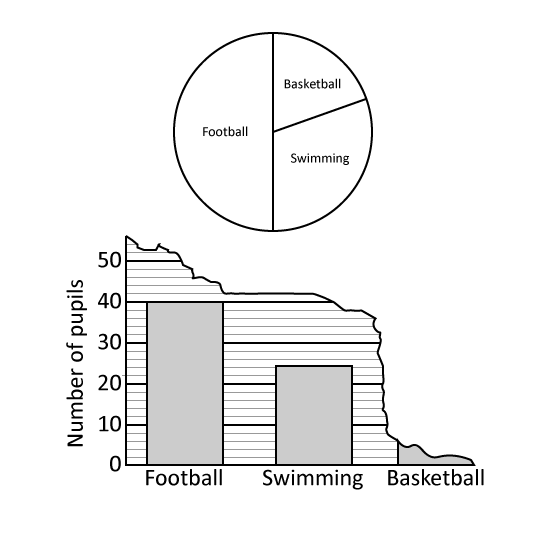
A group of boys were asked to choose their favourite sport from swimming, basketball and football. The pie chart represents the boys choices. Half of the group chose football.
What percentage of the group chose swimming?
The boys' choices were also represented by a bar graph. Part of the graph had been torn off. How many boys chose basketball?
Level 2 PSLE
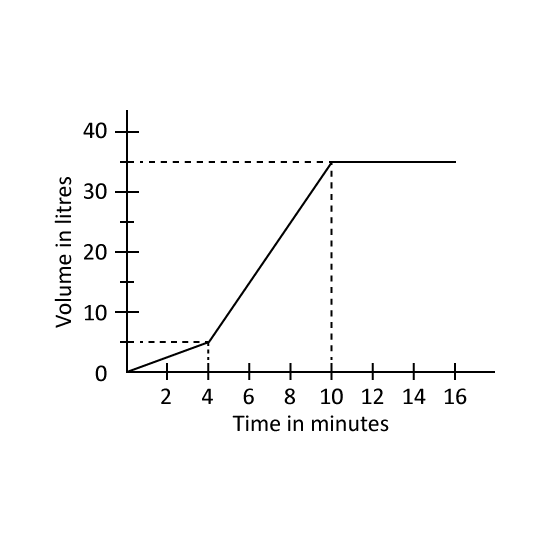
Carlo filled a container with water using two taps. He turned on Tap A first and after 4 minutes, he also turned on Tap B. Both taps were turned off at the same time when the container was completely filled without overflowing. The graph shows the amount of water in the container over 16 minutes.
What fraction of the container was filled 4 minutes after Tap A was turned on? Express your answer in the simplest form.
In one minute, how many litres of water flowed from Tap B?
Level 2 PSLE
Carlo filled a container with water using two taps. He turned on Tap A first and after 4 minutes, he also turned on Tap B. Both taps were turned off at the same time when the container was completely filled without overflowing. The graph shows the amount of water in the container over 16 minutes.
What fraction of the container was filled 4 minutes after Tap A was turned on? Express your answer in the simplest form.
In one minute, how many litres of water flowed from Tap B?
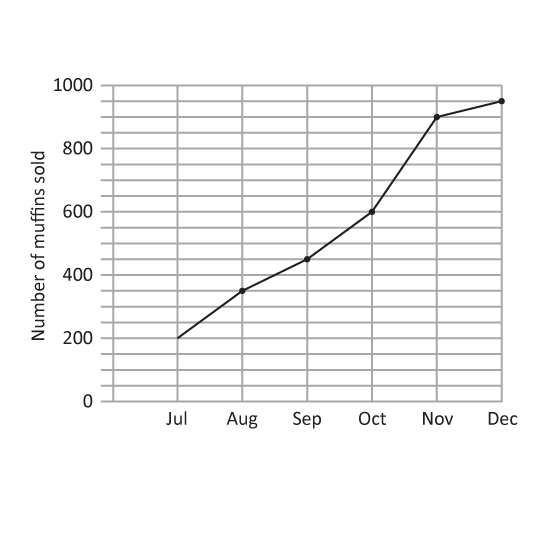
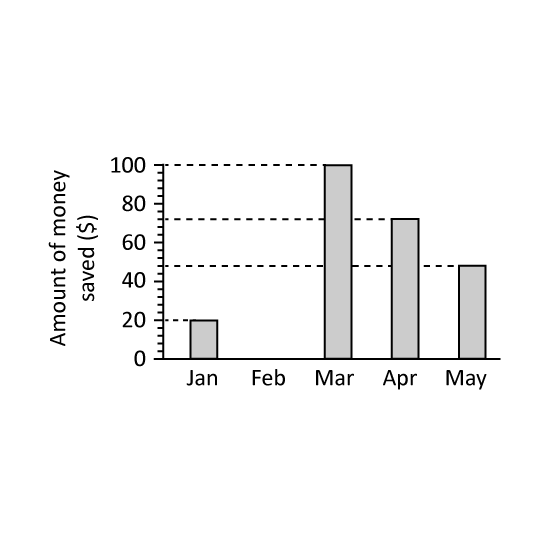
Level 2 The graph shows the amount of money Ron saved from his pocket money every month from January to May.
How much money did Ron save altogether from January to May?
What was the average amount of money Ron saved from January to May?
Ron saved $80 in June. The amount saved increased by 100% from June to July and another 100% from July to August. How much money did Ron save in August?