Level 1 PSLE
The line graph shows the temperature of soup in a pot from 08 00 to 08 35. (Give your answers in °C.)
  1. What was the temperature of the soup at 08 25?
  2. What was the increase in temperature per minute over the first 5 minutes?
2 m
Level 2 PSLE
The graph shows the amount of water that flows from a tap. At this rate, how many litres will flow from the tap in 28 minutes?
2 m
Level 3 PSLE
The graphs show the total number of leaflets machines A and B printed from the start. Both machines started printing at the same time.
  1. How many more leaflets did B print than A in 5 minutes?
  2. Both machines did not change their rates of printing throughout. When A had printed 200 leaflets, how many leaflets had B printed?
2 m
Level 1 PSLE
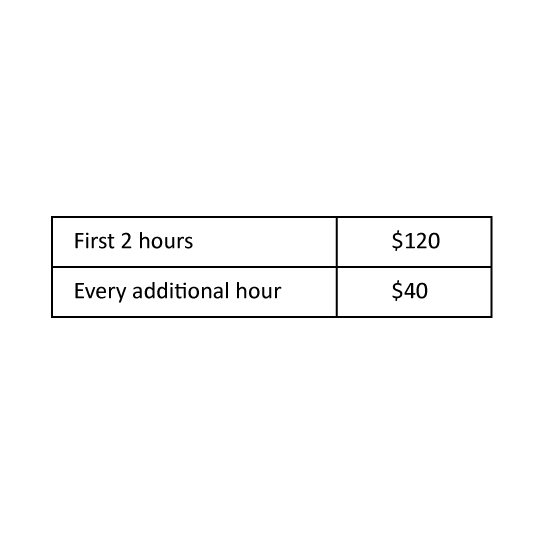
The table shows how much a company charges for a cleaning job. Mrs Menon paid the company $320 for a cleaning job. How many hours of cleaning did she pay for?
2 m
Level 1 PSLE
The table shows the charges for bicycle rental. Lenny rented a bicycle from 9.30 a.m. to 12.15 p.m. How much did he pay?
2 m