Level 2
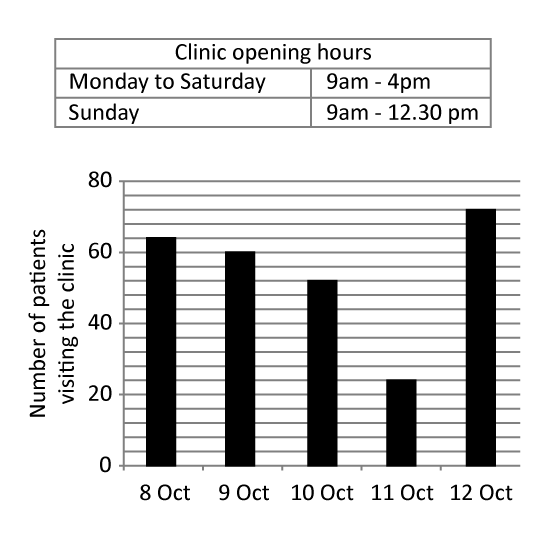
The bar graph shows the number of patients visiting a clinic during a period of time. The average number of patients visiting the clinic is 8 patients per hour.
Which date is most probably a Sunday?
What is the total number of patients visiting the clinic from 8 October to 12 October?
Level 2
The bar graph shows the number of patients visiting a clinic during a period of time. The average number of patients visiting the clinic is 8 patients per hour.
Which date is most probably a Sunday?
What is the total number of patients visiting the clinic from 8 October to 12 October?