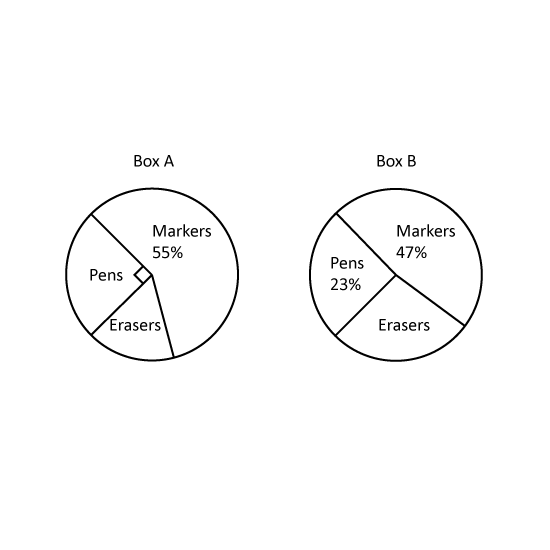
Level 2 The pie charts show the number of each type of stationery in boxes, A and B. The total number of stationery in Box A is twice the total number of stationery in Box B.
Find the percentage of erasers in Box A.
What fraction of stationery in Box B is erasers?
The number of erasers in Box A is 40. Find the number of erasers in Box B.
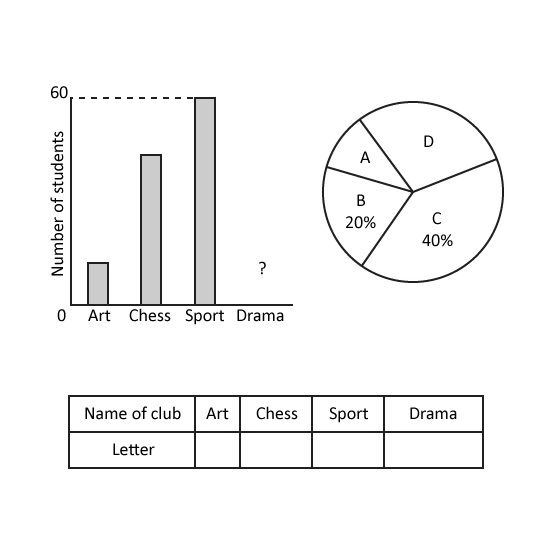
Level 3 PSLE Students joined one of the four clubs. The bar graph represents the number of students in the clubs. The bar for Drama Club is not shown. There were twice as many students in the Drama Club as in the Art Club. The information is also represented by a pie chart. The names of the clubs are represented by the letters A, B, C and D.
Identify the letters with their respective clubs. Give your answers in the following format. (Eg A, B, C, D)
How many students were there altogether?
Level 3 PSLE Students joined one of the four clubs. The bar graph represents the number of students in the clubs. The bar for Drama Club is not shown. There were twice as many students in the Drama Club as in the Art Club. The information is also represented by a pie chart. The names of the clubs are represented by the letters A, B, C and D.
Identify the letters with their respective clubs. Give your answers in the following format. (Eg A, B, C, D)