Level 1
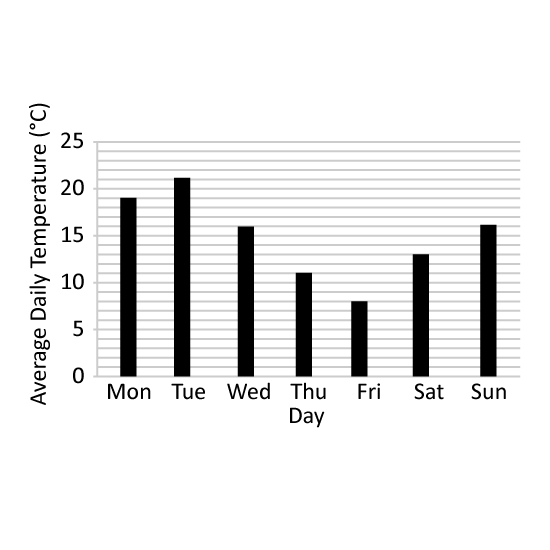
The bar graph shows the average daily temperature experienced by Country A in a week. What was the difference in the highest and lowest average daily temperatures in that week?
Level 1
The bar graph shows the average daily temperature experienced by Country A in a week. What was the difference in the highest and lowest average daily temperatures in that week?
Level 1 PSLE
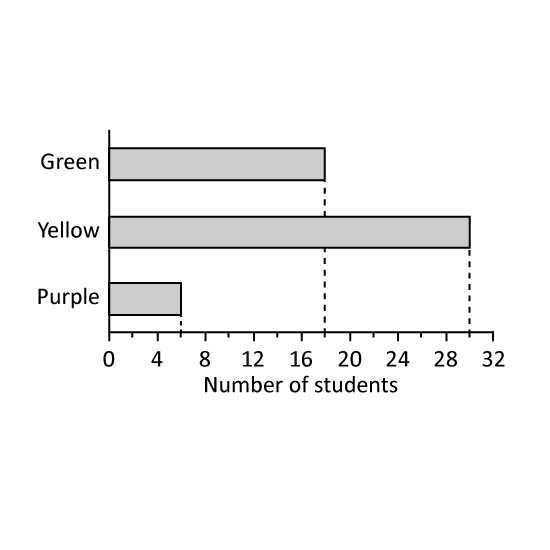
Mr Lim asked some students to choose their favorite colour for a T-shirt. The results are shown in the graph.
What is the ratio of the number of students who chose purple to the number who chose green to the number who chose yellow?
Mr Yip ordered a total of 360 T-shirts in the three colours according to the same ratio in part (a). How many more yellow than purple T-shirts were ordered?
Level 1 PSLE
Mr Lim asked some students to choose their favorite colour for a T-shirt. The results are shown in the graph.
What is the ratio of the number of students who chose purple to the number who chose green to the number who chose yellow?
Mr Yip ordered a total of 360 T-shirts in the three colours according to the same ratio in part (a). How many more yellow than purple T-shirts were ordered?
Level 2 PSLE The bar graphs show the sale of child tickets and adult tickets to a funfair over four days. The scale of the graph for adult tickets is not shown.
How many child tickets were sold in total on Tuesday and Thursday?
The ratio of the number of adult tickets sold on Monday to the total number of tickets sold on that day was 4 : 5. How many adult tickets were sold on Thursday?
Level 2 PSLE
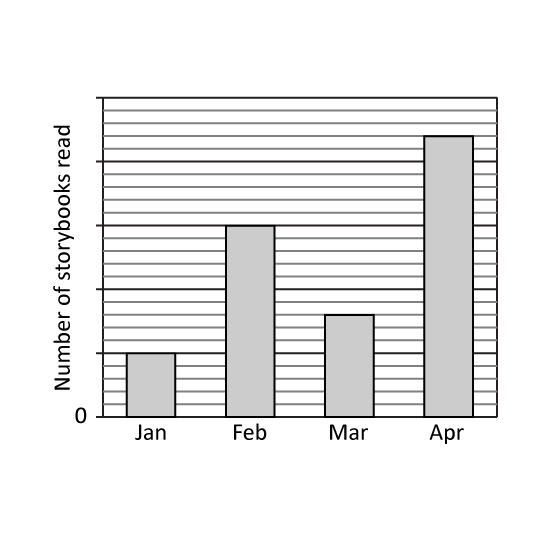
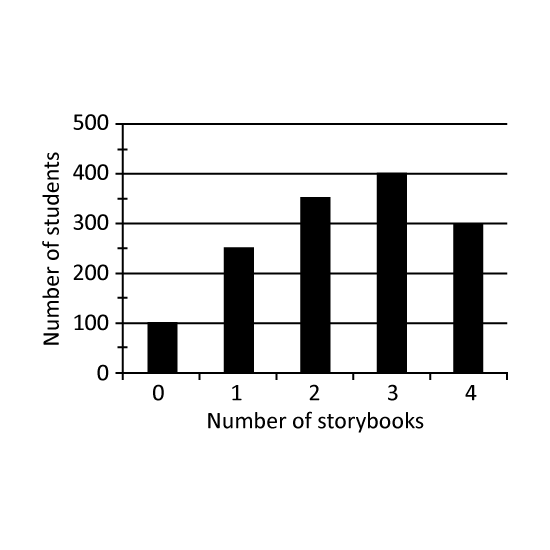
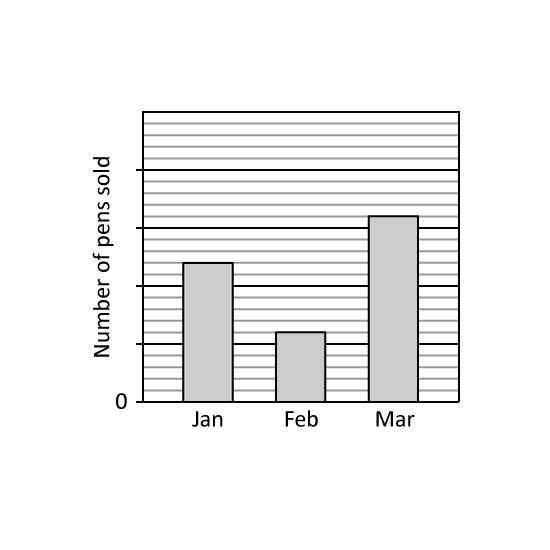
The bar graph shows the number of storybooks read by a class from January to April. The number of storybooks read is not shown on the scale.
What was the percentage increase in the number of storybooks read from January to February?
The average number of books read in a month from January to April was 25. How many books did the class read in April?
Level 2 PSLE
The bar graph shows the number of storybooks read by a class from January to April. The number of storybooks read is not shown on the scale.
What was the percentage increase in the number of storybooks read from January to February?
The average number of books read in a month from January to April was 25. How many books did the class read in April?
Level 3 PSLE
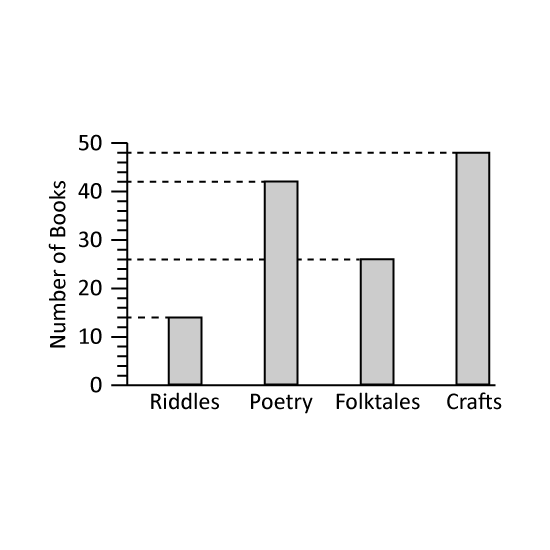
Books in a class library are grouped according to the following four types: Riddles, Poetry, Folktale, and Crafts. The bar graph shows the number of books of each type in the class library.
What percentage of books in the class library was of the Folktale type?
There were 38 students in the class. Every student in the class took three or four books home to read over the weekend. No book was left in the classroom. How many students took three books home?
Level 3 PSLE
Books in a class library are grouped according to the following four types: Riddles, Poetry, Folktale, and Crafts. The bar graph shows the number of books of each type in the class library.
What percentage of books in the class library was of the Folktale type?
There were 38 students in the class. Every student in the class took three or four books home to read over the weekend. No book was left in the classroom. How many students took three books home?
Level 2
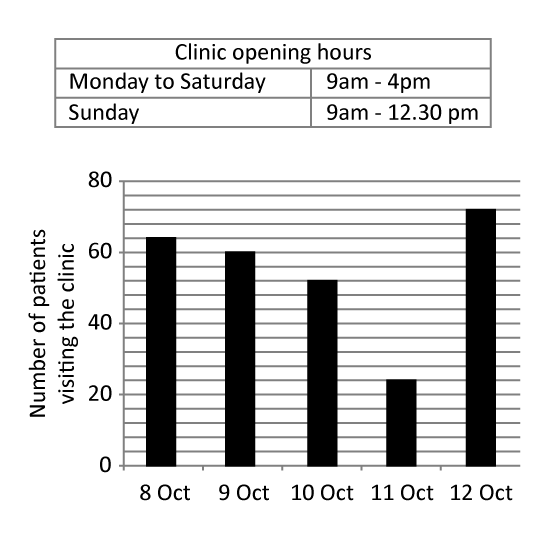
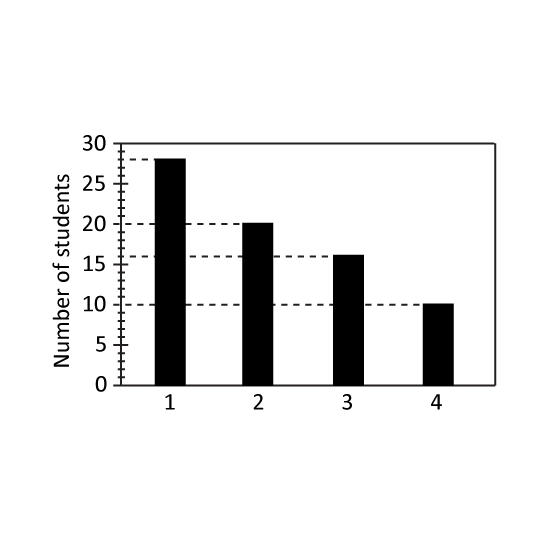
The bar graph shows the number of patients visiting a clinic during a period of time. The average number of patients visiting the clinic is 8 patients per hour.
Which date is most probably a Sunday?
What is the total number of patients visiting the clinic from 8 October to 12 October?
Level 2
The bar graph shows the number of patients visiting a clinic during a period of time. The average number of patients visiting the clinic is 8 patients per hour.
Which date is most probably a Sunday?
What is the total number of patients visiting the clinic from 8 October to 12 October?
Level 2
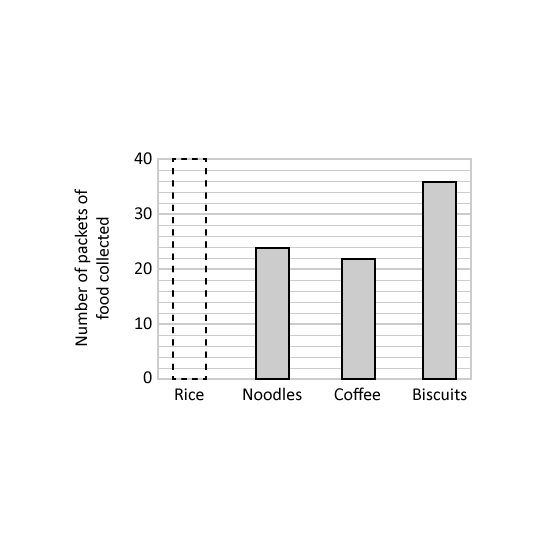
The bar graph shows the number of packets of different food collected in a donation drive.
15 of the total number of packets of food collected was coffee. How many packets of rice were collected?
The table shows the mass of each packet of food. What is the difference between the total mass of noodles collected and the total mass of biscuits collected? Give your answer in kg.
Level 2
The bar graph shows the number of packets of different food collected in a donation drive.
15 of the total number of packets of food collected was coffee. How many packets of rice were collected?
The table shows the mass of each packet of food. What is the difference between the total mass of noodles collected and the total mass of biscuits collected? Give your answer in kg.
Level 3
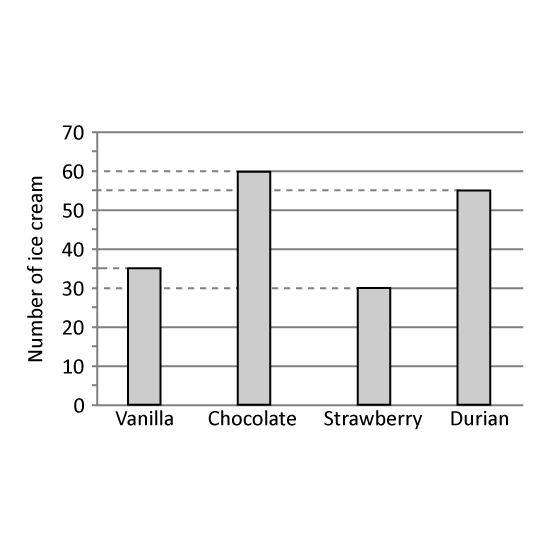
The bar graph shows the number of ice-cream flavours sold at a shop in a day.
What percentage of the ice-creams sold was durian ice-creams? Give your answer correct to 1 decimal place.
The cost of each ice-cream was the same. The amount of money collected for vanilla ice-creams was $15 more than the amount of money collected for strawberry ice-creams. What was the total amount of money collected from the sale of all the ice-creams?
Level 3
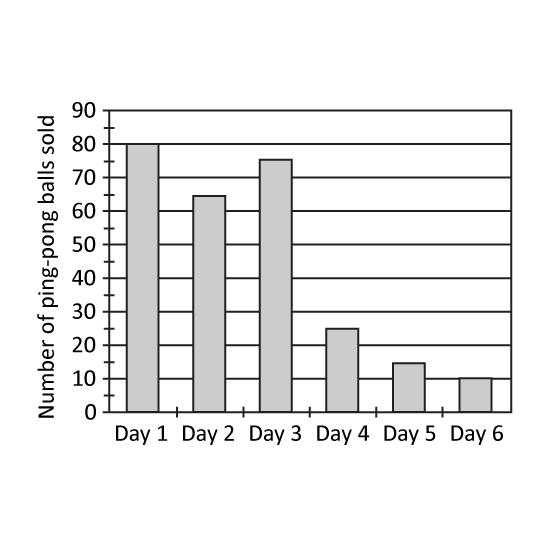
A sports shop had 300 ping-pong balls for sale. Each ping-pong ball is sold at $2. At the end of each day, the number of ping-pong balls was recorded in the bar graph shown.
What fraction of the total number of ping-pong balls was left at the end of Day 3? Express your answer in its simplest form.
If the shop decided to sell every 5 ping-pong balls at $9.30 from Day 4 onwards, how much less would it collect from the sale of the ping-pong balls?
Level 3
A sports shop had 300 ping-pong balls for sale. Each ping-pong ball is sold at $2. At the end of each day, the number of ping-pong balls was recorded in the bar graph shown.
What fraction of the total number of ping-pong balls was left at the end of Day 3? Express your answer in its simplest form.
If the shop decided to sell every 5 ping-pong balls at $9.30 from Day 4 onwards, how much less would it collect from the sale of the ping-pong balls?
Level 2 PSLE
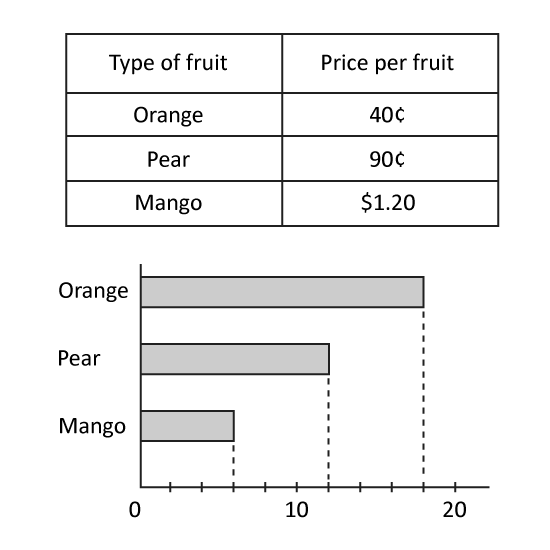
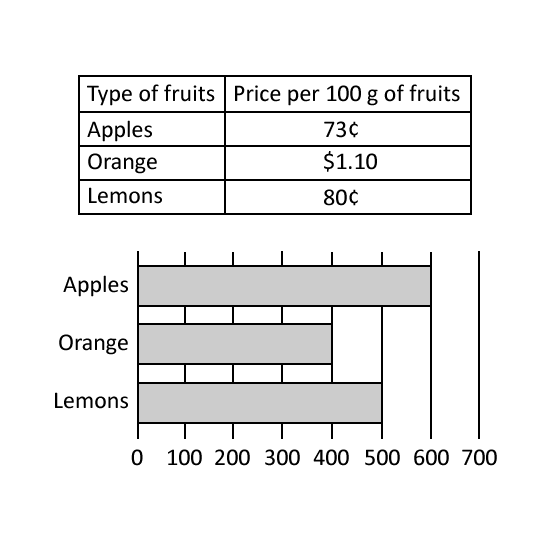
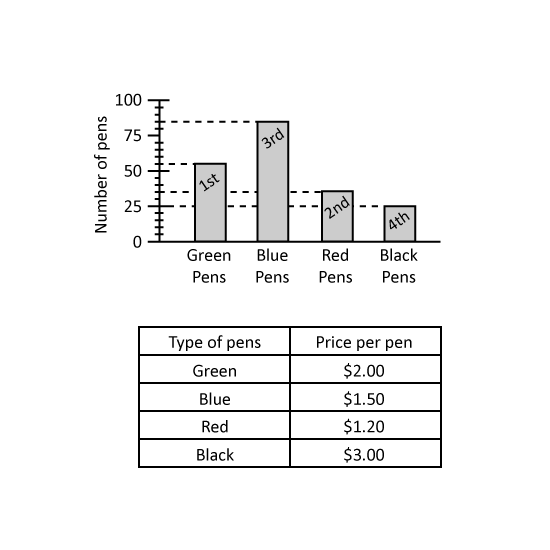
The bar graph shows the number of coloured pens sold by a shop. The table shows the prices of the pens.
What fraction of the pens sold were black pens? Give the answer in the simplest form.
From the sale of the pens, which coloured pens collected the least amount of money? What was the amount? Give the answers in the following way. (Eg Green, $1)
Level 2 PSLE
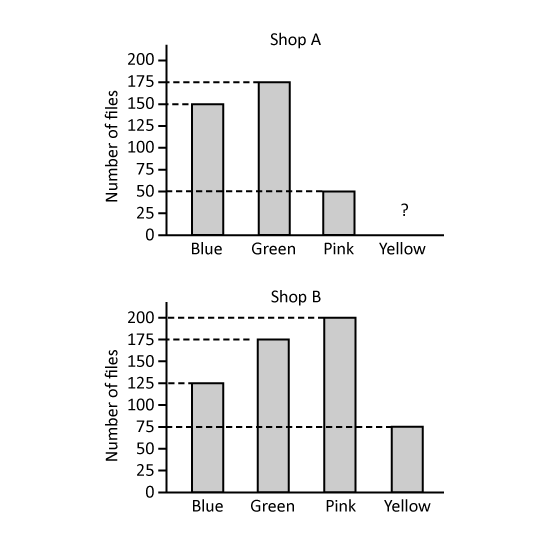
Shops A and B sell highlighters of four colours. The bar graphs show the number of highlighters sold by each shop in April.
The bar for the number yellow highlighters sold by Shop A has not been drawn.
Half of the highlighters sold by Shop A were yellow highlighters. How many yellow highlighters did Shop A sell?
Which colour(s) of highlighters did Shop A sell less than Shop B? (Give your answer(s) in letter(s) in alphabetical order. Eg Blue, Red = B, R
In May, Shop B sold 75 more blue highlighters than the number of blue highlighters sold in April. What was the percentage increase in the number of blue highlighters sold by Shop B from April to May?
Level 2 PSLE
Shops A and B sell highlighters of four colours. The bar graphs show the number of highlighters sold by each shop in April.
The bar for the number yellow highlighters sold by Shop A has not been drawn.
Half of the highlighters sold by Shop A were yellow highlighters. How many yellow highlighters did Shop A sell?
Which colour(s) of highlighters did Shop A sell less than Shop B? (Give your answer(s) in letter(s) in alphabetical order. Eg Blue, Red = B, R
In May, Shop B sold 75 more blue highlighters than the number of blue highlighters sold in April. What was the percentage increase in the number of blue highlighters sold by Shop B from April to May?
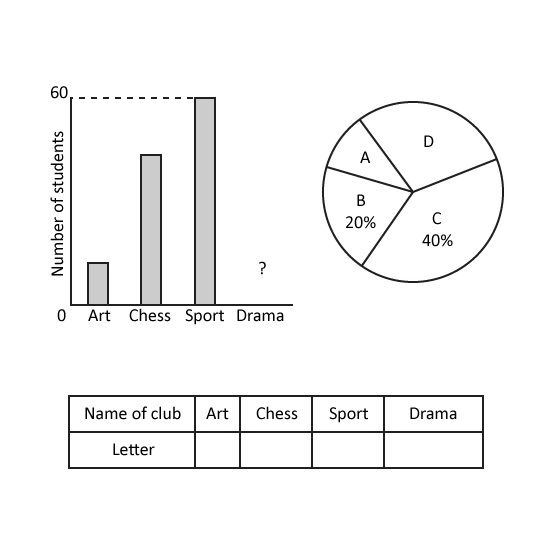
Level 3 PSLE Students joined one of the four clubs. The bar graph represents the number of students in the clubs. The bar for Drama Club is not shown. There were twice as many students in the Drama Club as in the Art Club. The information is also represented by a pie chart. The names of the clubs are represented by the letters A, B, C and D.
Identify the letters with their respective clubs. Give your answers in the following format. (Eg A, B, C, D)
How many students were there altogether?
Level 3 PSLE Students joined one of the four clubs. The bar graph represents the number of students in the clubs. The bar for Drama Club is not shown. There were twice as many students in the Drama Club as in the Art Club. The information is also represented by a pie chart. The names of the clubs are represented by the letters A, B, C and D.
Identify the letters with their respective clubs. Give your answers in the following format. (Eg A, B, C, D)