Level 2
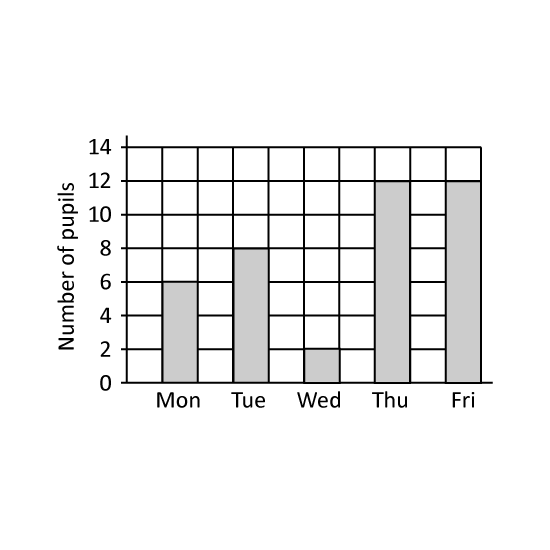
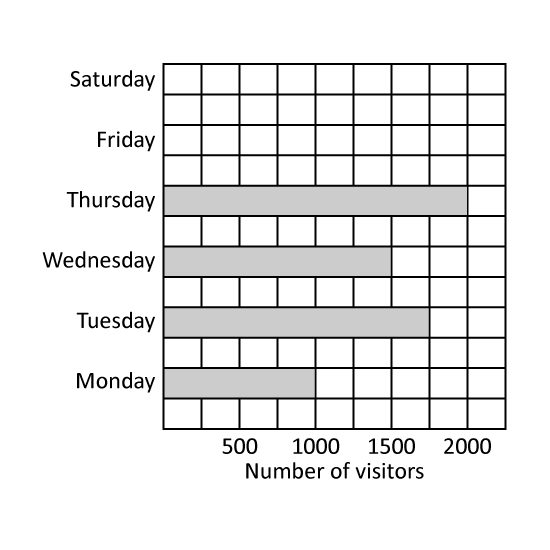
The graph shows the number of children who visited the amusement park. How many more children visited the amusement park on Wednesday than on Monday?
Level 2
The graph shows the number of children who visited the amusement park. How many more children visited the amusement park on Wednesday than on Monday?
Level 2
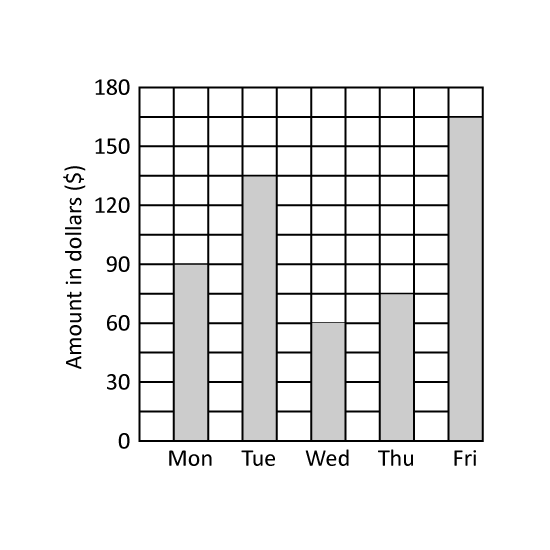
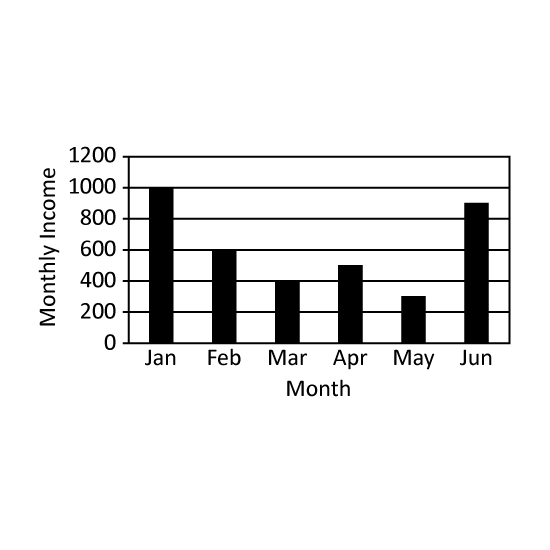
The graph shows how much Mary earned from Monday to Friday. The total amount Mary earned on two of the days is the same as what she earned on Tuesday. Which were the two days? Give the answers in short form. (Eg Mon, Thu)
Level 2
The graph shows how much Mary earned from Monday to Friday. The total amount Mary earned on two of the days is the same as what she earned on Tuesday. Which were the two days? Give the answers in short form. (Eg Mon, Thu)
Level 2
The graph shows the number of children who visited the amusement park from Monday to Saturday. Each entrance ticket to the amusement park was sold at $9. How much money was collected on Wednesday?
Level 2
The graph shows the number of children who visited the amusement park from Monday to Saturday. Each entrance ticket to the amusement park was sold at $9. How much money was collected on Wednesday?
Level 2
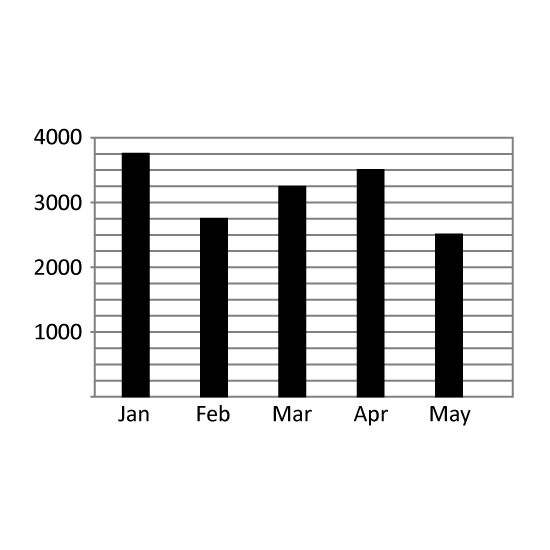
The graph shows the monthly income of Mr Chai for the first half of the year. In which month was his income 35 of her combined income in January and April? Give the answer in short form. (Eg Jan)
Level 2
The graph shows the monthly income of Mr Chai for the first half of the year. In which month was his income 35 of her combined income in January and April? Give the answer in short form. (Eg Jan)
Level 1 PSLE
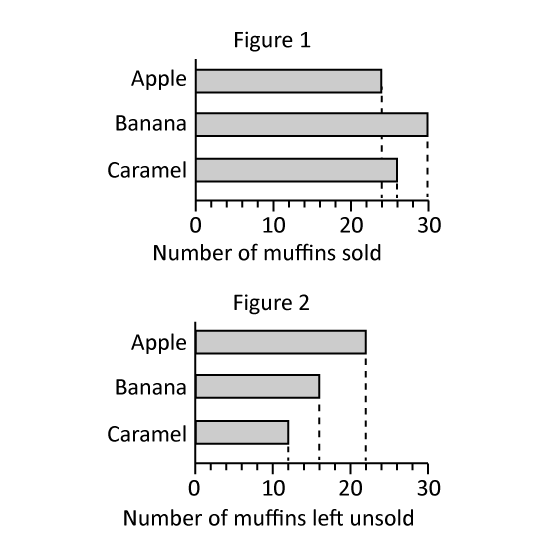
Jen baked some muffins to sell at a funfair. Figure 1 shows the number of muffins that was sold. Figure 2 shows the number of muffins left unsold at the end of the funfair.
What was the number of caramel muffins Jen baked?
Altogether, how many apples and banana muffins were left unsold after the funfair?
Level 1 PSLE
Jen baked some muffins to sell at a funfair. Figure 1 shows the number of muffins that was sold. Figure 2 shows the number of muffins left unsold at the end of the funfair.
What was the number of caramel muffins Jen baked?
Altogether, how many apples and banana muffins were left unsold after the funfair?
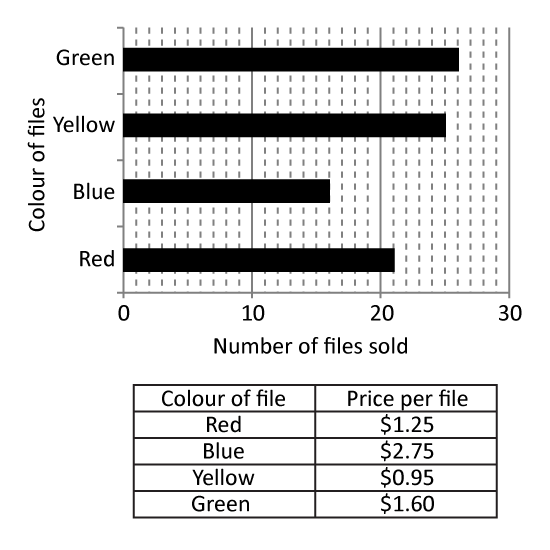
Level 2
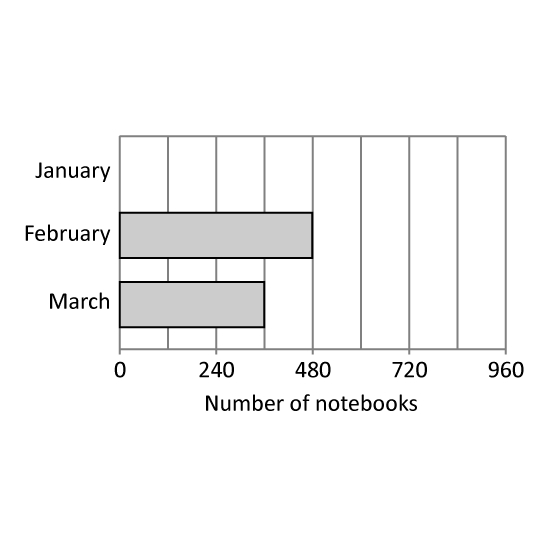
The bar graph shows the number of notebooks sold in 3 months. The bar that shows the number of notebooks in January is not drawn. 38 of the total number of notebooks sold in the 3 months were sold in January. How many notebooks were sold in January?
Level 2
The bar graph shows the number of notebooks sold in 3 months. The bar that shows the number of notebooks in January is not drawn. 38 of the total number of notebooks sold in the 3 months were sold in January. How many notebooks were sold in January?