Level 3
12 of Adam's money is equal to 25 of Bryan's money.
Adam has $20.
  1. How much does Bryan have?
  2. How much does Adam have less than Bryan?
  3. How much do they have altogether?
4 m
Level 3
Zeph sold 35 of the tarts he made in the morning and half of the remainder in the afternoon. He had 6 tarts left unsold.
  1. How many tarts did he sell altogether?
  2. If he sold 3 tarts for $1.60, how much did he receive from the tarts he sold?
4 m
Level 2
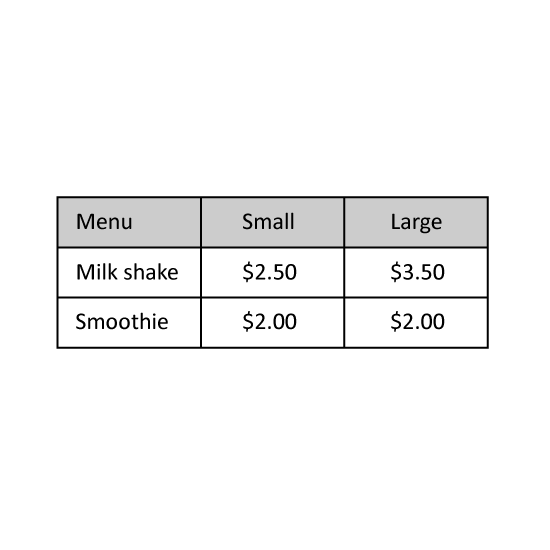
The table shows part of a menu at a fast food restaurant. Benny wanted to buy 1 small smoothie and 1 large milk shake. How much more money would he need if he had only six 50-cent coins in his wallet?
3 m
Level 3
Ben bought some pastries. He bought some cupcakes with $9.20 more than half his money. He then bought some puffs with $7.20 less than half of his remaining money. He then had $12.80 left. How much did he pay for the cupcakes?
4 m
Level 2
The graph shows the number of burgers sold by a fast-food restaurant in a week.
  1. Which day showed a decrease in the number of burgers sold compared to the previous day?
  2. Each burger was sold at $4 each. How much money did the restaurant earn from the total sales on Saturday and Sunday?
3 m
Level 2
The graph shows the number of cars sold by Mr Lee from March to July.
  1. How many cars did Mr Lee sell from May to July?
  2. Mr Lee sold 19 fewer cars in February than in March, how many cars did he sell in February?
3 m
Level 2
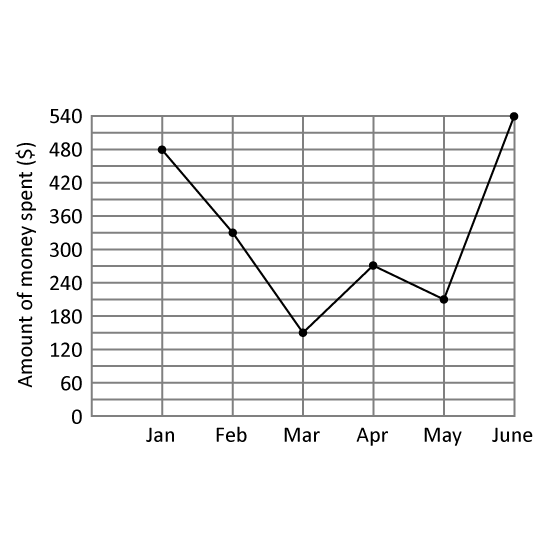
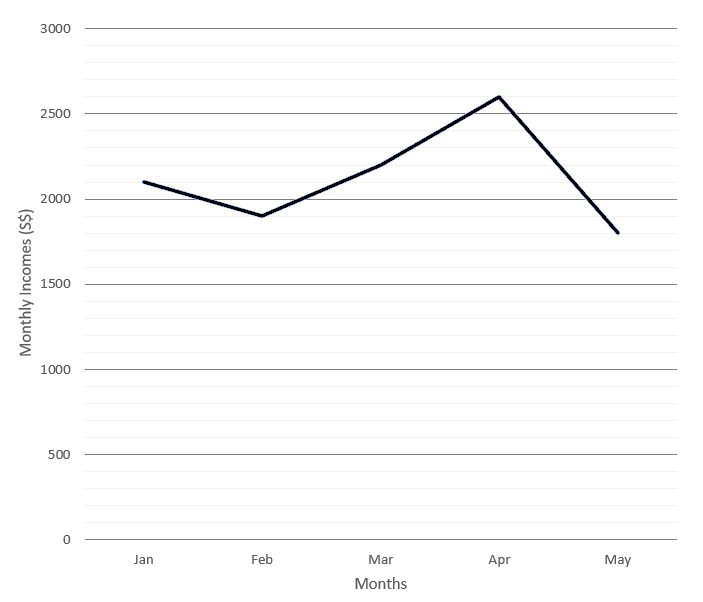
The line graph shows the amount of money Joseph spent from January to June.
  1. Of the amount Joseph spent in February, $138 was spent on clothes and the remaining amount was spent on food. How much did he spend on food in February?
  2. In which month did Joseph spend $120 more than the previous month? Give your answer in this format. (Eg Jan)
3 m
Level 2
The line graph shows the number of chicken wings sold from Monday to Sunday.
  1. On which two days are the increase/decrease the same from their previous day? Answer in short form eg Mon, Tue.
  2. If each chicken wing was sold at $1.20, what was the total amount of money collected on the day with the least sale?
3 m
Level 2
The line graph shows the sale of different types of ice cream in a store in a day.
  1. Which is the most popular type of ice cream? Give the first letter of the answer. (Eg Apple = A)
  2. What is the difference in sales between the most popular and the least popular type of ice cream?
  3. What was the total amount collected from the sale of the ice creams in the day?
3 m
Level 2
The graph shows the income George made when he worked as a banker from January to May.
  1. What was the difference between the highest and lowest income earned by George?
  2. Between which two months was the decrease in George's income the greatest? Give the answer in short form. (Eg Jan, Feb)
3 m