Level 2 The pie charts show the number of each type of stationery items in boxes, A and B. The total number of stationery items in Box A is twice the total number of stationery items in Box B.
Find the percentage of erasers in Box A.
What fraction of stationery items in Box B is erasers?
The number of erasers in Box A is 40. Find the number of erasers in Box B.
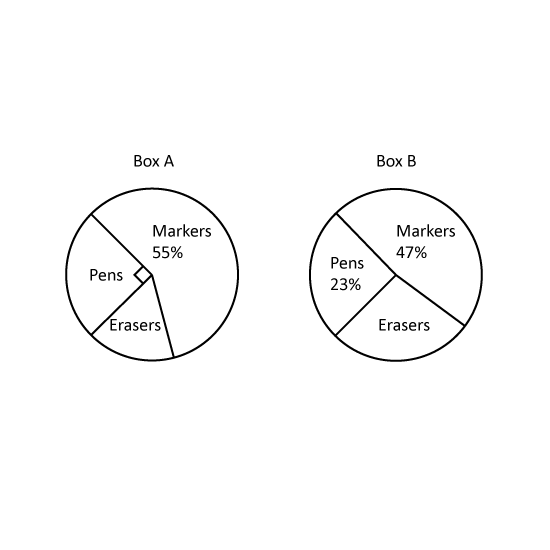