Level 2
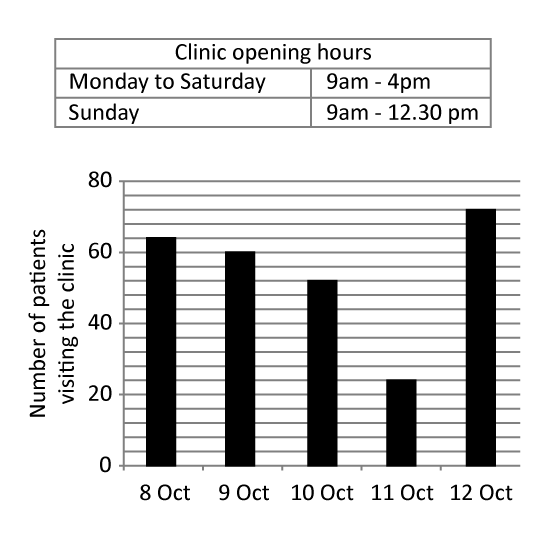
The bar graph shows the number of patients visiting a clinic during a period of time. The average number of patients visiting the clinic is 8 patients per hour.
Which date is most probably a Sunday?
What is the total number of patients visiting the clinic from 8 October to 12 October?
Level 2
The bar graph shows the number of patients visiting a clinic during a period of time. The average number of patients visiting the clinic is 8 patients per hour.
Which date is most probably a Sunday?
What is the total number of patients visiting the clinic from 8 October to 12 October?
Level 3
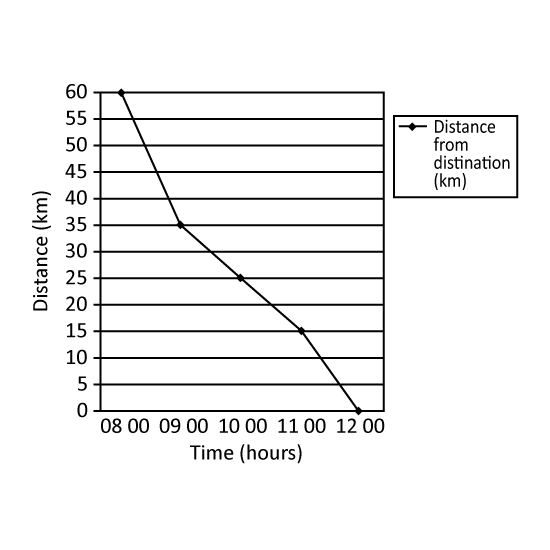
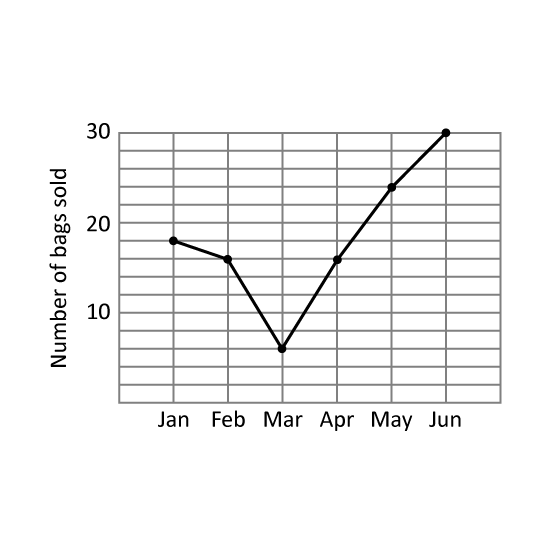
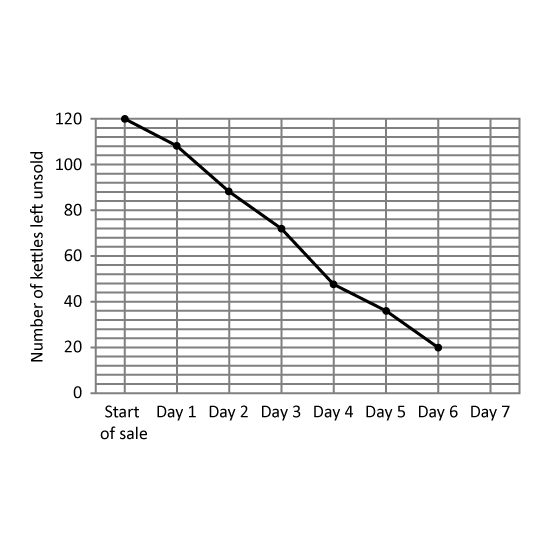
A departmental store had 120 kettles for sale during a 7-day period. The line graph shows the number of kettles left unsold at the end of each day. The number of kettles left unsold at the end of Day 7 was not shown.
On which day (from Day 1 to Day 7), was the greatest number of kettles sold? Give your answer in number. (Eg 1)
The average number of kettles sold for the last three days was 14. How many kettles were sold on Day 7?
Level 3
A departmental store had 120 kettles for sale during a 7-day period. The line graph shows the number of kettles left unsold at the end of each day. The number of kettles left unsold at the end of Day 7 was not shown.
On which day (from Day 1 to Day 7), was the greatest number of kettles sold? Give your answer in number. (Eg 1)
The average number of kettles sold for the last three days was 14. How many kettles were sold on Day 7?
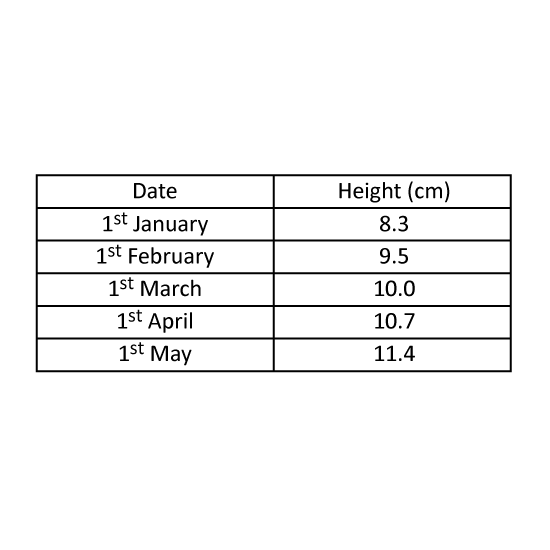
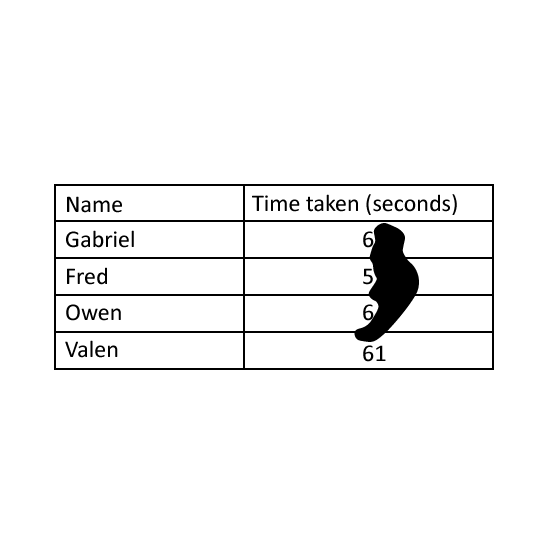
Level 3 The table shows the time taken by 4 participants in a race. All the times recorded are in whole numbers. Some of the time recorded were blocked by an ink drop. The average time taken by the 4 participants was 60 seconds. The difference between the time taken by Gabriel and Owen was 2 seconds. Find the shortest possible time taken by Fred.
Level 3 The table shows the time taken by 4 participants in a race. All the times recorded are in whole numbers. Some of the time recorded were blocked by an ink drop. The average time taken by the 4 participants was 60 seconds. The difference between the time taken by Gabriel and Owen was 2 seconds. Find the shortest possible time taken by Fred.
Level 3
Sam and Bryan are asked to give out the same number of leaflets. Sam can give out the leaflets in 9 hours while Bryan can give out the leaflets in 6 hours. Both workers started giving out the leaflets at the same time for 5 hours. After 5 hours, Sam gave out 180 leaflets. How many leaflets can Bryan give out in 5 hours?
Level 3
Mr Gopi uses two pipes to fill a pool. The first pipe can fill the pool in 6 h. The second pipe can fill the pool in 8 h. Two house after both pipes are turned on, Mr Thomas accidentally opens the pipe which can drain the pool completely in 12 h. With the 3rd pipe now remained open, what is the total time taken by Mr Gopi to fill the pool completely? Express your answer in h.
Level 3
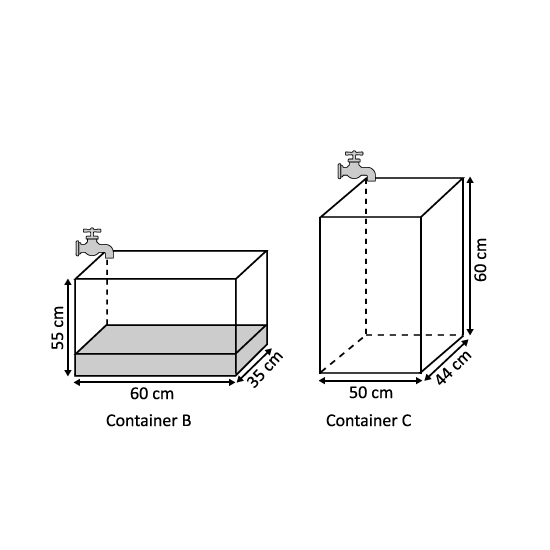
At first, 13 of Container B was filled with water and Container C was empty. Then, both taps were turned on at the same time and water from both taps flowed at the same rate of 2.2 litres per minute. Both taps were turned off immediately when Container B was filled to the brim.
How much water was there in Container B at first?
How long did it take for the water from the tap to fill Container B to the brim?
What fraction of Container C was filled with water in the end? Give your answer in the simplest form.
Level 3
At first, 13 of Container B was filled with water and Container C was empty. Then, both taps were turned on at the same time and water from both taps flowed at the same rate of 2.2 litres per minute. Both taps were turned off immediately when Container B was filled to the brim.
How much water was there in Container B at first?
How long did it take for the water from the tap to fill Container B to the brim?
What fraction of Container C was filled with water in the end? Give your answer in the simplest form.