Level 2
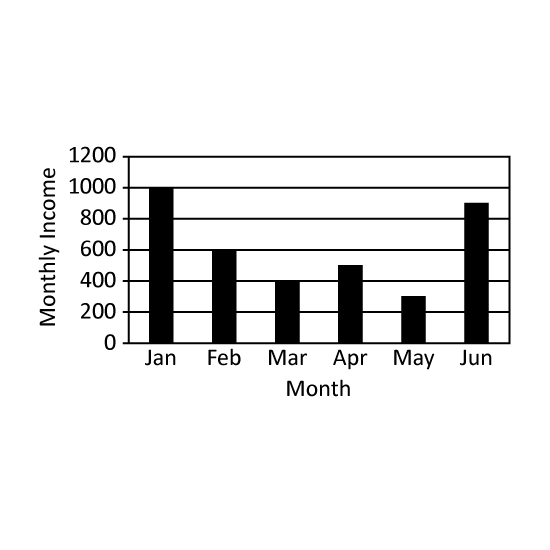
The graph shows the monthly income of Mr Chai for the first half of the year. In which month was his income 35 of her combined income in January and April? Give the answer in short form. (Eg Jan)
Level 2
The graph shows the monthly income of Mr Chai for the first half of the year. In which month was his income 35 of her combined income in January and April? Give the answer in short form. (Eg Jan)
Level 2
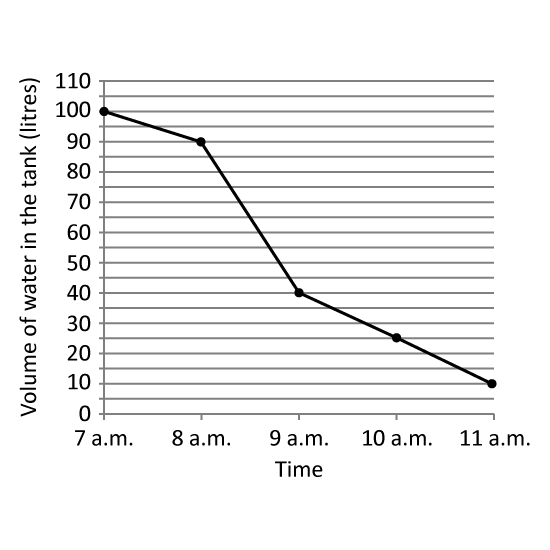
A tank was completely filled with water at 7 a.m Water flowed out of the tank from 7 a.m. to 11 a.m. The line graph shows the volume of water in the tank at each 1-hour interval from 7 a.m. to 11 a.m. At what time was 14 of the tank filled with water?
Level 2
A tank was completely filled with water at 7 a.m Water flowed out of the tank from 7 a.m. to 11 a.m. The line graph shows the volume of water in the tank at each 1-hour interval from 7 a.m. to 11 a.m. At what time was 14 of the tank filled with water?