Level 2 PSLE
A 2-digit number, under 50, when divided by 40 gives a remainder of 9. What can be added to the number to change it to a smallest multiple of 12?
Level 2
A 2-digit number less than 37 gives a remainder of 6 when divided by 10. It gives a remainder of 4 when divided by 8. List the possible number(s) in ascending order.
Level 2
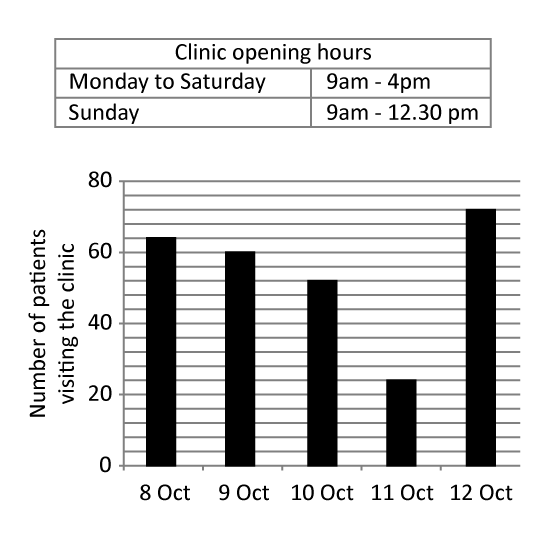
The bar graph shows the number of patients visiting a clinic during a period of time. The average number of patients visiting the clinic is 8 patients per hour.
Which date is most probably a Sunday?
What is the total number of patients visiting the clinic from 8 October to 12 October?
Level 2
The bar graph shows the number of patients visiting a clinic during a period of time. The average number of patients visiting the clinic is 8 patients per hour.
Which date is most probably a Sunday?
What is the total number of patients visiting the clinic from 8 October to 12 October?
Level 2
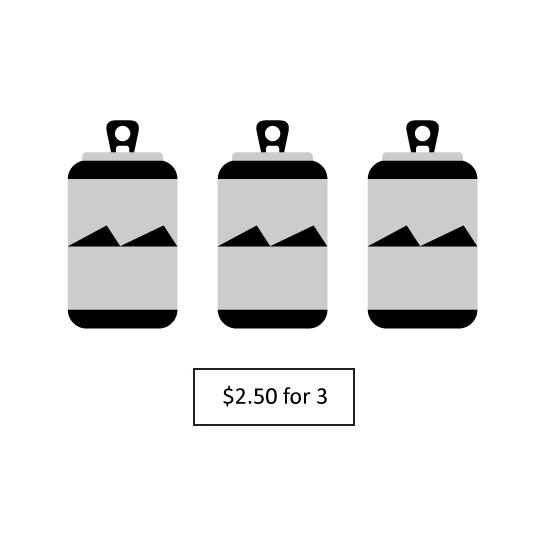
Can drinks are sold in packs of 3 and each pack costs $2.50. Find the most number of can drinks that can be bought with a $10 note if the can drinks are sold at a discount of 20%.
Level 2
Can drinks are sold in packs of 3 and each pack costs $2.50. Find the most number of can drinks that can be bought with a $10 note if the can drinks are sold at a discount of 20%.
Level 2
Peter and Gabriel went to buy mobile phones at a sale. The usual price of 1 mobile phone was $600 each. SALE
Buy 1 mobile phone at 15% discount
Buy 2 or more mobile phones at 25% discount each
Peter bought 1 mobile phone. How much did he pay?
What is the maximum number of mobile phones Gabriel can buy if he has $7000?
Level 2
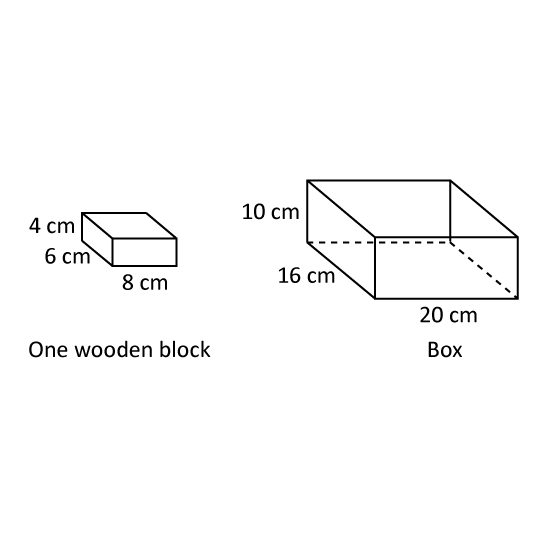
Amelia wanted to pack some wooden blocks into a rectangular box. The dimensions of the box and the wooden block are given. Find the greatest number of wooden blocks that Amelia can pack into the box.
Level 2
Amelia wanted to pack some wooden blocks into a rectangular box. The dimensions of the box and the wooden block are given. Find the greatest number of wooden blocks that Amelia can pack into the box.
Level 3
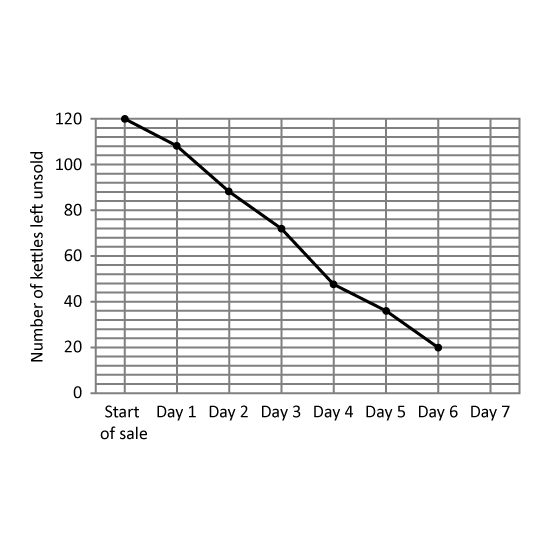
A departmental store had 120 kettles for sale during a 7-day period. The line graph shows the number of kettles left unsold at the end of each day. The number of kettles left unsold at the end of Day 7 was not shown.
On which day (from Day 1 to Day 7), was the greatest number of kettles sold? Give your answer in number. (Eg 1)
The average number of kettles sold for the last three days was 14. How many kettles were sold on Day 7?
Level 3
A departmental store had 120 kettles for sale during a 7-day period. The line graph shows the number of kettles left unsold at the end of each day. The number of kettles left unsold at the end of Day 7 was not shown.
On which day (from Day 1 to Day 7), was the greatest number of kettles sold? Give your answer in number. (Eg 1)
The average number of kettles sold for the last three days was 14. How many kettles were sold on Day 7?