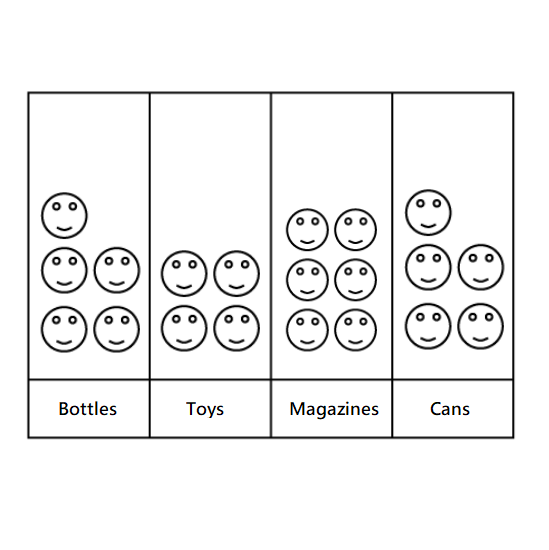
Level 2
Adam has 30 stickers.
Bryan has 20 more stickers than Adam.
How many stickers does Bryan have?

  1. Which model should we draw?
    (1) Model Part-whole
    (2) Model Comparison
  2. Is the total given?
    (1) Yes
    (2) No
  3. Who gets the shorter bar?
    (1) Adam
    (2) Bryan
  4. Number of stickers that Bryan has =
4 m
Adam and Bryan have 100 stickers.
Adam has 20 more stickers than Bryan.
Find the number of stickers that Bryan has.

  1. Which model should we draw?
    (1) Model Part-whole
    (2) Model Comparison
  2. Is the total given?
    (1) Yes
    (2) No
  3. Who gets the shorter bar?
    (1) Adam
    (2) Bryan
  4. Number of stickers that Bryan has =
4 m
Level 2
The sum of two numbers is 1000.
One number is 200 less than the other number.
What are the two numbers?

  1. The smaller number.
  2. The larger number.
2 m
Level 3
Look at the picture graph.
This graph shows 4 item types that John collected for his recycling project. Give the answers in numbers.
  1. John collected _____ magazines.
  2. He collected _____ more magazine than toys.
  3. He collected the same number of _____ and _____ . (Eg 1, 2)
  4. He collected _____ items altogether.
4 m
Level 1
Adam has 200 stickers.
Bryan has 100 stickers less than Adam.
  1. How many stickers do Bryan have?
  2. What is the total number of stickers they have?
3 m
Level 2
3 children have 2000 stickers.
Adam has 800 stickers.
Bryan has 300 less than Adam.
How many stickers does Chris have?
2 m
Level 2
Adam has 30 stickers.
Bryan has 20 more stickers than Adam.
How many stickers do they have?

  1. Which model should we draw?
    (1) Model Part-whole
    (2) Model Comparison
  2. Is the total given?
    (1) Yes
    (2) No
  3. Who gets the shorter bar?
    (1) Adam
    (2) Bryan
  4. Number of stickers that Bryan has =
4 m
Level 1
Adam and Bryan have 10 stickers.
Adam has 2 less stickers than Bryan.
Find the number of stickers that Adam has.

  1. Which model should we draw?
    (1) Model Part-whole
    (2) Model Comparison
  2. Is the total given?
    (1) Yes
    (2) No
  3. Who gets the shorter bar?
    (1) Adam
    (2) Bryan
  4. Number of stickers that Adam has =
4 m
Level 3
Look at the picture graph.
This graph shows the favourite board games of a group of children. Each smiley stands for 1 child. Give the answers in numbers.
  1. _____ children like Scrabble.
  2. 5 more children prefer Snap to _____.
  3. _____ fewer children prefer chess to Monopoly.
  4. The same number of children like _____ and _____. (Eg 1, 2)
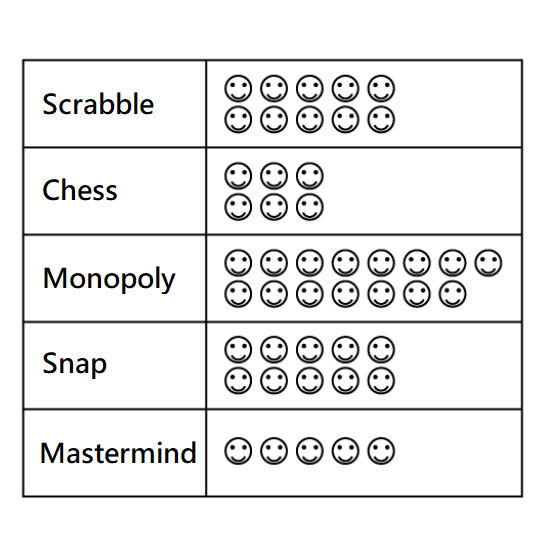
4 m
Level 2
Adam has 30 stickers.
Bryan has 20 less stickers than Adam.
How many stickers does Bryan have?

  1. Which model should we draw?
    (1) Model Part-whole
    (2) Model Comparison
  2. Is the total given?
    (1) Yes
    (2) No
  3. Who gets the shorter bar?
    (1) Adam
    (2) Bryan
  4. Number of stickers that Bryan has =
4 m