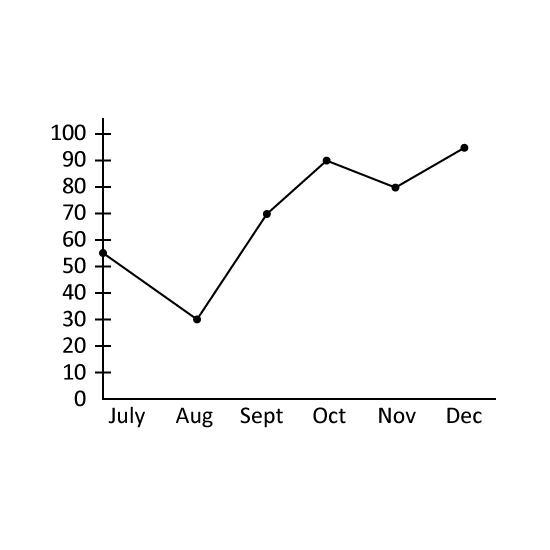
Level 2
The graph shows the temperature of water in a pot from 08 00 to 08 30.
  1. For how many minutes was the temperature of the water 50°C and below?
  2. During which two 5-minute intervals did the temperature of water decrease at the same rate?
  3. What was the change in temperature per minute from 08 25 to 08 30? Give your answer in °C per minute.
3 m
Level 3
The line graph shows the number of dresses sold by a shop from July to December in 2013.
  1. What was the average number of dresses sold per month from July to December in 2013?
  2. The total number of dresses sold for the same period from July to December in 2012 was 672. Find the percentage decrease in the total number of dresses sold for the same period from 2012 to 2013.
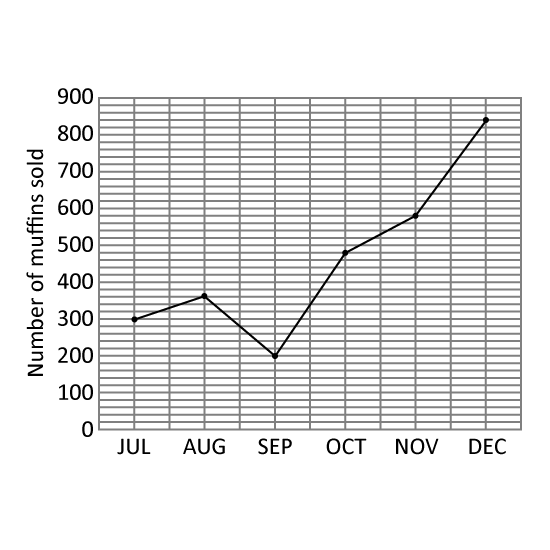
3 m
Level 3
The line graph shows the distance a driver was from his destination which was 60 km away over a period of time.
  1. How long did he take to reach his destination?
  2. At 10 00, how far had he travelled?
  3. How far did the driver drive during the period of his fastest speed?
3 m
Level 3
The graph shows the number of muffins sold each month by a bakery from July to December in 2015.
  1. In which month were the least muffins sold? Express the month in short form. Eg Jan
  2. What was the total number of muffins sold in the last 3 months of the year?
3 m
Level 3
The bookshop sells 4 different coloured pens. The line graph shows the number of pens sold for each colour in a week.
  1. What was the difference between the number of blue and black pens sold?
  2. Each red pen cost $0.30 more than each green pen. The bookshop collected $84 from selling the green pens. What was the price of 1 red pen?
3 m